
Julienne Stroeve (Professor of Polar Observation and Modelling, University College London), 6 March 2018
Arctic sea ice extent tracked at record low levels during February, leading to a new record low for the month of February in 2018 (Figure 1). Low sea ice conditions are in part a result of an exceptionally warm Arctic from anomalous atmospheric circulation patterns on both sides of the Arctic during the month of February. On the Pacific side, low sea level pressure over the Kamchatka Peninsula was coupled with high pressure over Alaska. This fostered strong southerly winds that brought warm air (10 to 12oC above average; Figure 2) and warm ocean waters into the Bering Strait and Chukchi Sea, impeding southward ice growth and reducing the sea ice cover.
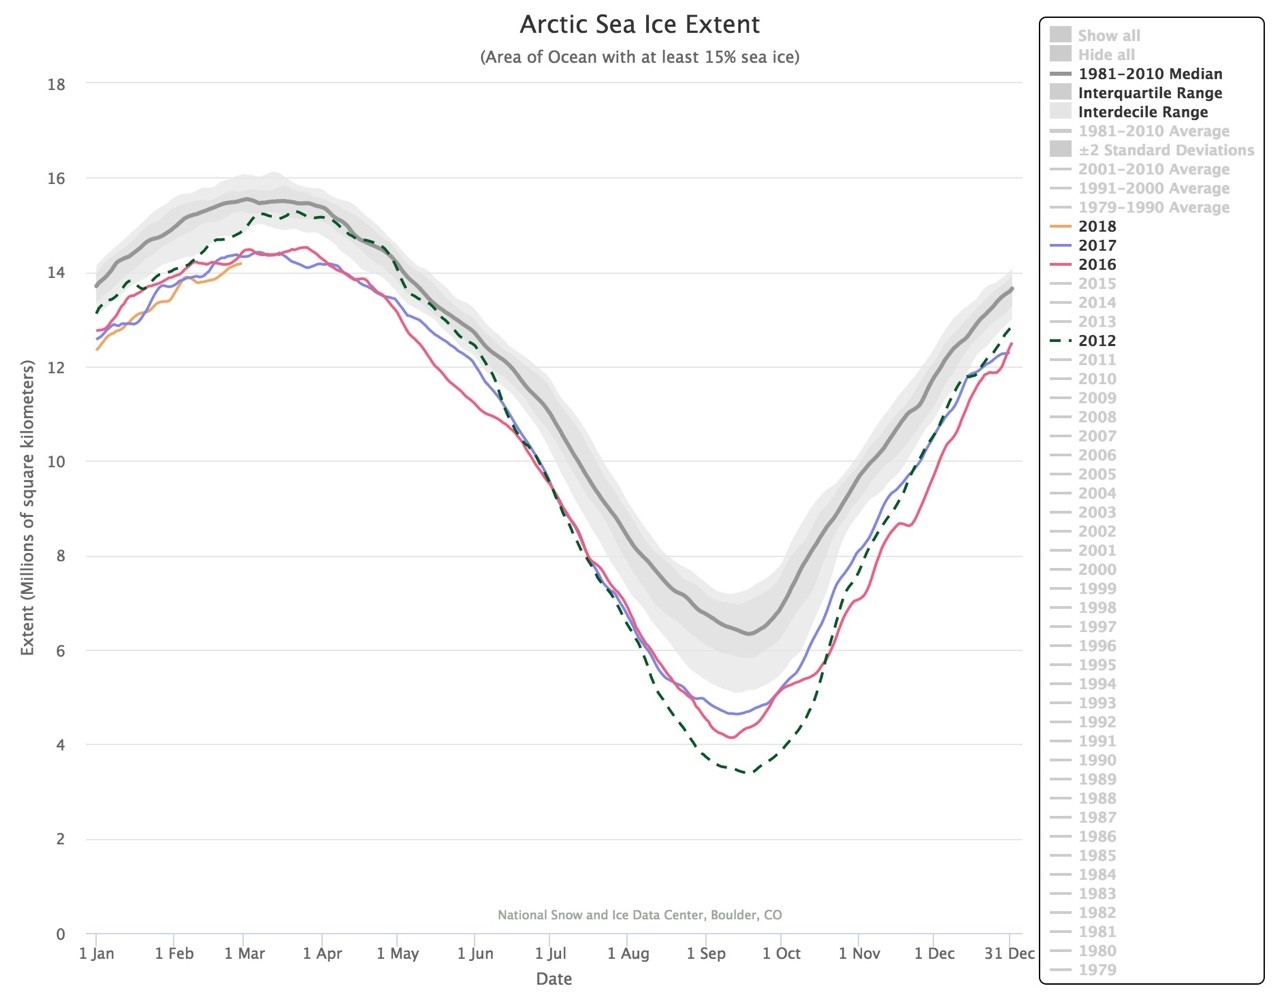 Figure 1. Comparison of total Arctic sea ice extent from 1 January through 31 December for 2018 (orange), 2017 (purple), 2016 (pink), 2012 (green) and the 1981-2010 median (gray) with interquartile and interdecile range shown. Figure from NSIDC Charctic.
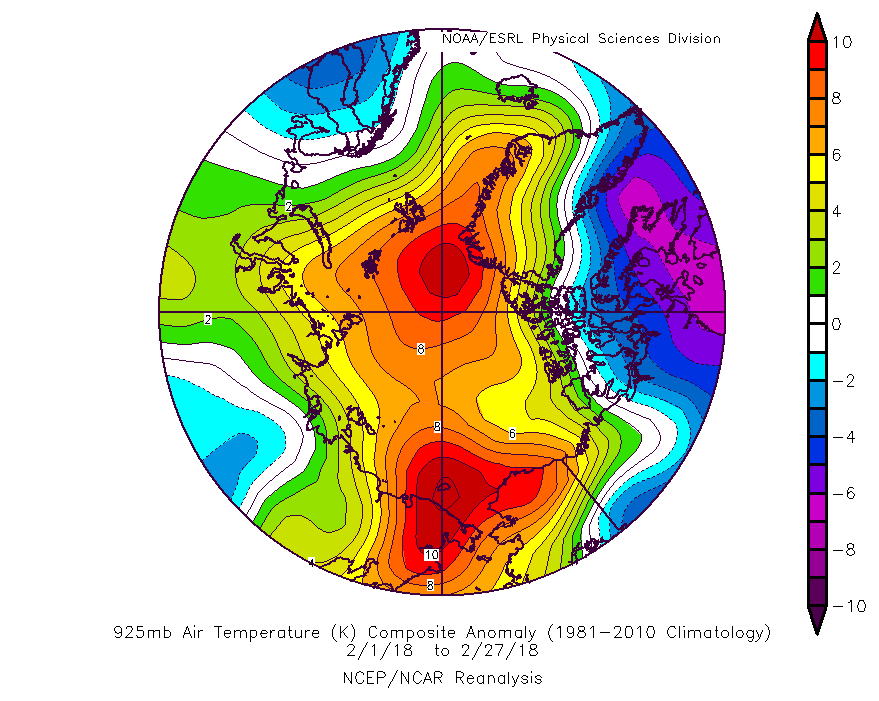
Figure 2. 925 hPa air temperature anomalies for February 2018 relative to the 1981-2010 mean using NCEP/NCAR reanalysis data.
On the Atlantic side, low pressure off the southeast coast of Greenland and high pressure over northern Europe helped to funnel warm winds into the region. At the end of February, this atmospheric circulation pattern was particularly strong, leading to a remarkable inflow of warm air from the south, raising the temperatures near the North Pole to above freezing, and 20 to 30°C above normal for this time of year. Air temperatures obtained at Cape Morris Jesup in northern Greenland (83o37’N, 33o22’W) exceeded 0oC for several hours. Above this station, a large sea ice fracture occurred, resulting in open water formation that likely also contributed to warmer than average air temperatures. Freezing degree-days is a measure of how cold it has been and how long it has been cold; cumulative freezing degree days is calculated as the sum of average daily degrees below freezing. Overall, cumulative freezing degree days since September 2017 shows the least amount of total freezing degree days by the end of February 2018, less than that observed last winter at this time which set the previous record for the least amount of cumulative temperatures below freezing (Figure 3).
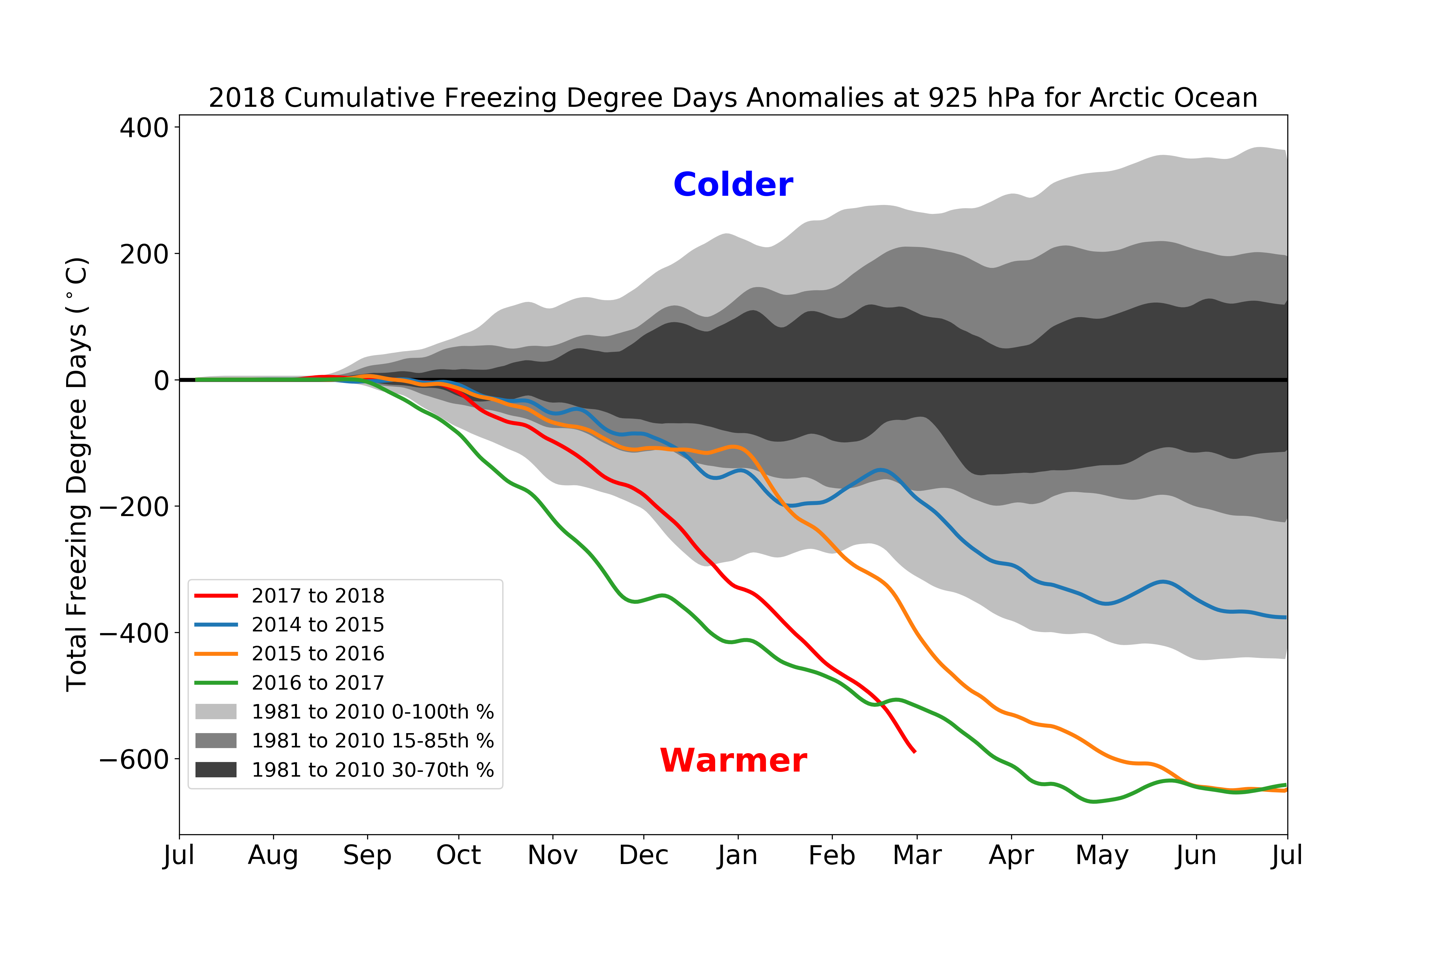
Figure 3. Cumulative freezing degree days through February 2018. Plot courtesy A. Barrett, NSIDC.
While the Arctic was “baking” in relative warmth, northern Europe saw temperatures plunge as cold Siberian air made its way south and eastward. Both the warm Arctic and cold Eurasia pattern are related to the sudden stratospheric warming (SSW) of two weeks ago. This event weakened the polar vortex, and allowed cold air from Siberia to be pushed in from the east, bringing frigid temperatures and snow to the UK. This may actually be part of a larger chain of events linking sea ice loss in the Kara and Barents seas with anomalous high pressure over northern Eurasia, forcing increased vertical wave propagation that weakens the polar vortex. A study published last year shows the polar vortex has weakened over the last four decades and accounts for most of the recent winter cooling trends over Eurasian mid-latitudes as sea ice within the Barents and Kara seas has continued to decline in winter [Kretschmer et al., 2017].
This is now the third winter in a row in which air temperatures at the pole have increased above 0oC and while these events are not entirely uncommon, they have become more frequent and lasted for longer than they used to [Graham et al., 2017]. These increases in winter air temperatures may be having a non-trivial impact on sea ice thickness by reducing overall thermodynamic ice growth [Stroeve et al., 2018]. Thickness anomalies from CryoSat-2 for this February show regions of thinner ice relative to the 2011-2017 average in regions where air temperatures in February were particularly warmer than average (e.g. Bering/southern Chukchi seas and near Svalbard and Fram Strait). Elsewhere, CryoSat-2 data suggests ice in the Lincoln Sea may be 60cm thicker than the 2011-2017 average and thicker ice (30-50cm) in the Laptev Sea and the southern Beaufort and northern Chukchi seas (Figure 4). Generally, regions with thinner ice are more likely to melt out during summer, though how much will depend on atmospheric circulation patterns this coming summer. What is clear is that significant Arctic sea ice loss is no longer a feature of summer only.
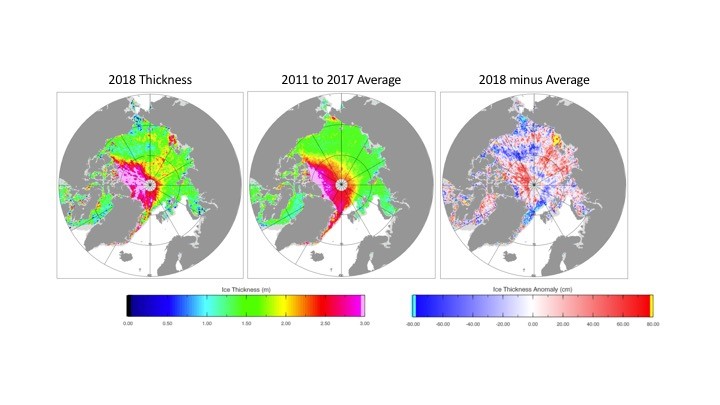
Figure 4. CryoSat-2 mean thickness for February 2018 (left), 2011-2017 mean (center) and 2018 anomaly (right). Figure courtesy A. Ridout.
References
Graham, R.M., L. Cohen, A.A. Petty, L.N. Boisvert, A. Rinke, S.R. Hudson, M. Nicolaus and M.A. Granskog, (2017), increasing frequency and duration of Arctic winter warming events, Geophys. Res. Lett., 16, 6974-6983, doi:10.1002/2017GL073395.
Kretschmer, M., D. Coumou, L. Agel, M. Barlow, E. Tziperman and J. Cohen (2017), more persistent weak stratospheric polar vortex states linked to cold extremes, Bull. Amer. Meteor. Soc., doi:10.1175/BAMS-D-16-0259.1.
Stroeve, J., D. Schroeder, M. Tsamados and D. Feltham, (2018), Warm winter, thin ice? The Cryosphere Discussion, doi:10.5194/tc-2017-287.