A team of researchers has produced the first dataset of Greenland Ice-Sheet-scale slush covering almost a decade (2016-2024) at 100 m resolution.
The study, published on 7 August 2026, used satellite imagery from ESA’s Sentinel-2 satellite and a ‘random forest classifier’, a machine learning method of categorisation, to map the ice sheet.
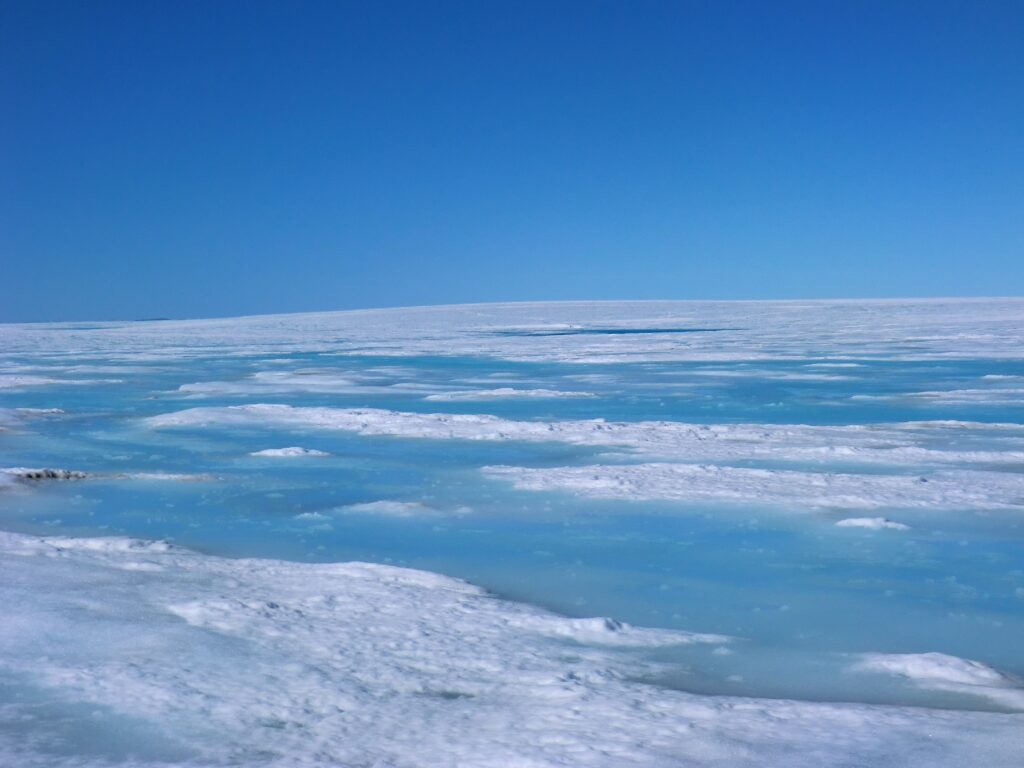
Image of slush taken on the Greenland Ice Sheet in 2011.
Image Credit: Professor Ian Willis (University of Cambridge).
The research was led by Dr Emily Glen (Penn State University) with co-authors Professor Alison Banwell (CPOM/Northumbria University), Dr Katie Miles (Lancaster University), Dr Amber Leeson (CPOM/Lancaster), Dr Rebecca Dell (Scott Polar Research Institute, University of Cambridge), Professor Mal McMillan (CPOM/Lancaster University), and CPOM Senior Research Associate, Dr Jennifer Maddalena (CPOM/Lancaster University).
Key findings from the research:
Lead author, Dr Emily Glen, who completed this work during her PhD at CPOM/Lancaster University and is now a Postdoctoral Researcher in Antarctic Ice Sheet Observations and Modeling at Penn State said:
“For the first time, we’ve been able to map slush across the whole Greenland Ice Sheet and show that it is a widespread and important part of the surface meltwater system that has largely been overlooked. This has been a huge collaborative effort with my co-authors and supervisors, and I’m really pleased that we can now make this nine-year dataset available to the wider community. I’m looking forward to seeing how other researchers use it, particularly to better understand Greenland’s surface hydrology and improve how slush is represented in future ice-sheet models.”
Being able to map slush accurately across an ice sheet is an important step forward for scientists monitoring these vast areas and for modelling projections in future ice sheet behaviour. As more melting occurs meltwater increases. At the same time the firn (a compacted layer of snow that is at least a year old) loses its capacity to absorb and store that water. These factors combined means slush becomes more prevalent on the surface, darkening the ice surface, reducing its albedo and absorbing more radiation from the sun, leading to a positive feedback mechanism.
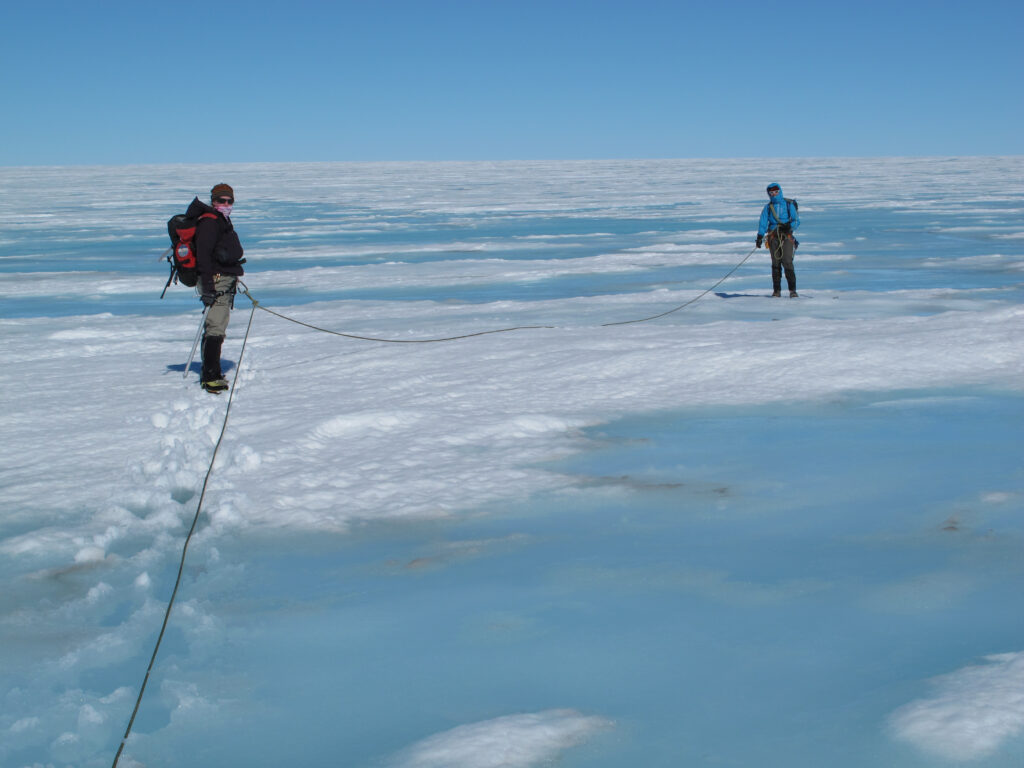
Image of field research being conducted on slush on the Greenland Ice Sheet in 2011.
Image credit: Professor Ian Willis (University of Cambridge).
Co-author Professor Alison Banwell, CPOM PI of Land Ice/Ice Shelf Earth Observation (Northumbria University) said:
“We have shown that slush is the dominant surface meltwater feature on the Greenland Ice Sheet, covering up to nine times the area of lakes and rivers. Because slush absorbs more sunlight than snow but isn’t explicitly included in current melt models, we’re likely underestimating how much meltwater Greenland produces.”
Slush is snow or firn that has become water-saturated and has been difficult to categorise using NDWI (Normalized Difference Water Index) thresholding as it can closely resemble snow and ice around it, as well as have ill-defined borders. The machine-learning model was trained using expert-reviewed examples of slush and achieved high accuracy in internal testing.
As the Earth’s climate continues to warm, slush is becoming an increasingly important factor in further amplifying melt on the ice sheet surface. By continuing to improve the methodology for identifying and mapping slush using satellite data, scientists can continue to improve the ways we monitor ice sheet behaviour and calibrate models to project future ice mass balance and associated contributions to global sea levels.
More information
You can read ‘A nine-year record of slush on the Greenland Ice Sheet’ in EGU The Cryosphere.
Authors: Emily Glen, Alison F. Banwell, Katie E. Miles, Amber A. Leeson, Rebecca L. Dell, Malcolm McMillan, and Jennifer Maddalena.
Funding note
This research was supported by the UK Natural Environment Research Council, the UK Centre for Polar Observation and Modelling, the European Space Agency and the U.S. National Science Foundation.
Images credit: Professor Ian Willis (The University of Cambridge)
21-09-2026