
In June, I was lucky enough to take part in a course run by the European Space Agency: Remote Sensing of the Cryosphere. Sixty researchers from across Europe were invited to Longyearbyen, Svalbard, high in the Arctic, to learn more about the techniques we can use to observe, monitor and protect the Earth’s ice. Here are a few of my highlights and my remote sensing take-aways from the week!
SvalSat
One highlight was our trip to SvalSat – a satellite ground station of 31 antennas that communicate with more satellites than any other on Earth. We were each invited to give a 1-minute lightning talk of our research beneath one of the giant antennas. Above our heads, the very latest Sentinel images were being downloaded, ready to be used by a researcher somewhere on Earth. Each antenna tracks the position of its satellites and follows it as it makes a pass, roughly every 100 minutes or so. Being so far north, SvalSat antennas are able to communicate with polar-orbiting satellites on every orbit of the Earth. Investment in SvalSat and the infrastructure to disseminate satellite data is also the reason that the rest of Longyearbyen is able to benefit from some very impressive internet speeds.
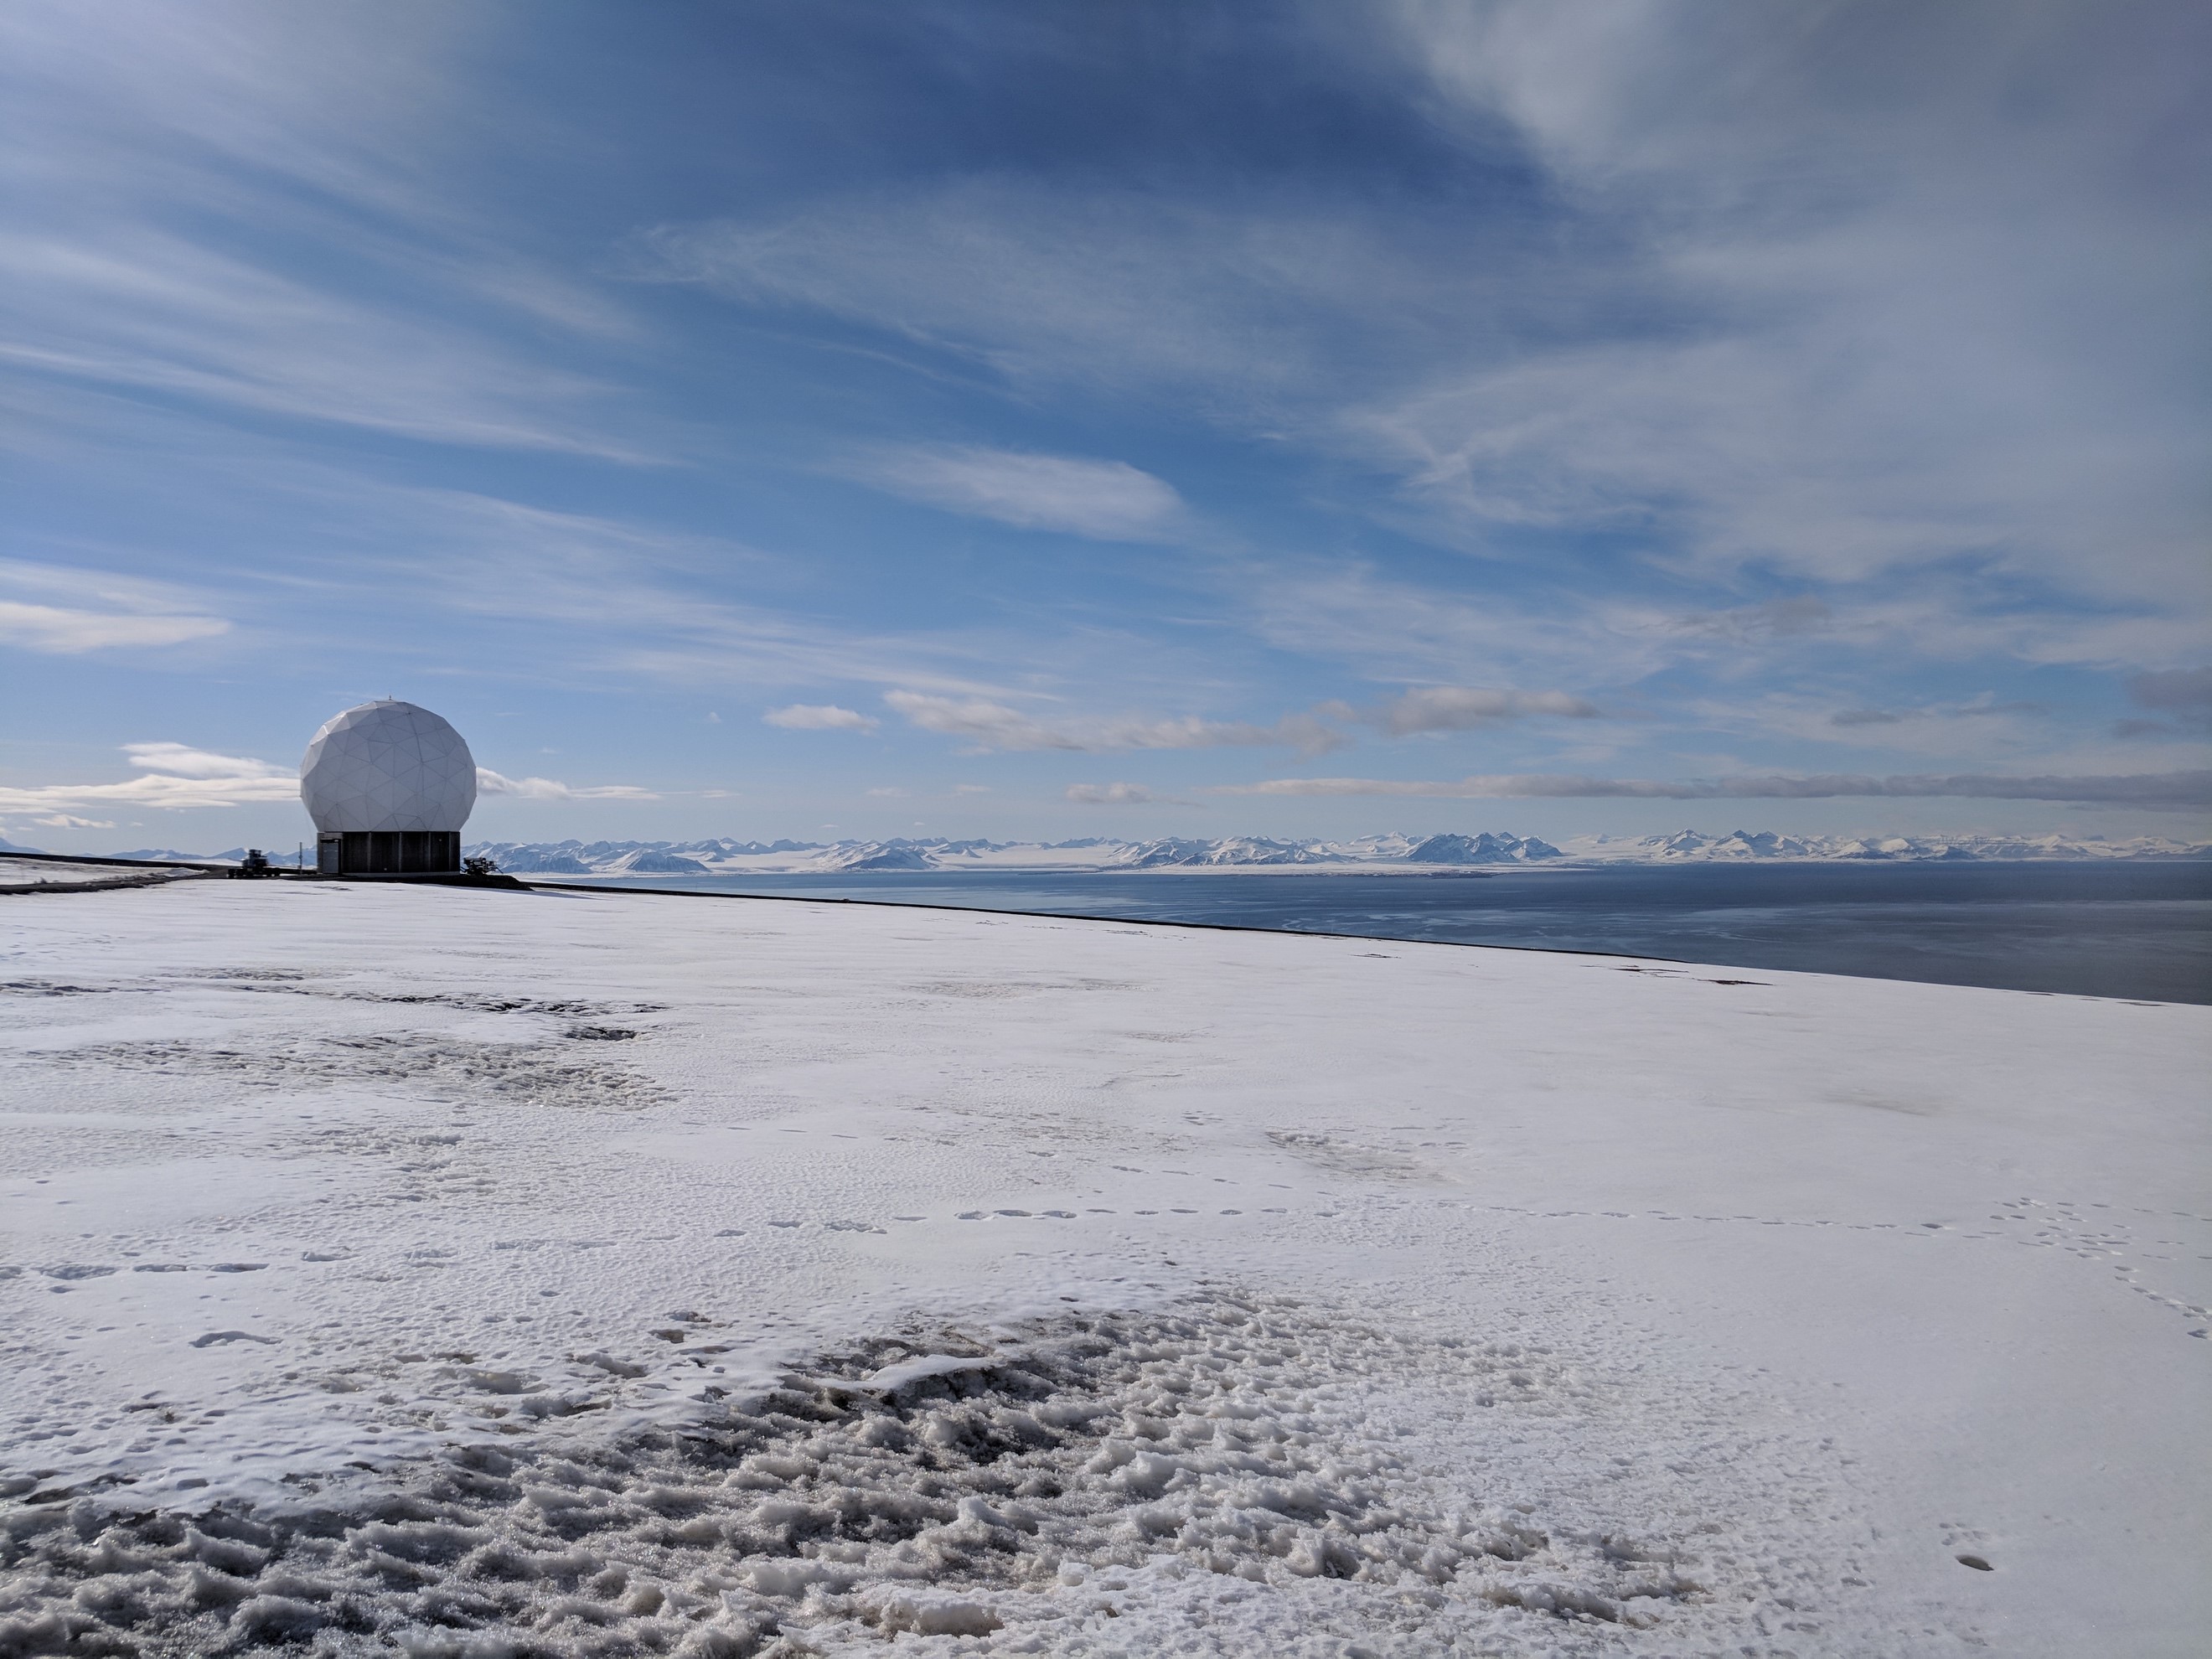
SvalSat – inside each of these domes is a satellite dish, ready and waiting to receive the latest remote sensing data
Recent dynamics of Svalbard glaciers
Using feature tracking and interferometry, Professor Adrian Luckman from the University of Swansea introduced us to the changing dynamics of Svalbard glaciers. The mass balance of Svalbard is strongly negative, and the region has a cluster of surge-type glaciers that have variable flow. High resolution TerraSAR-X imagery has been used to follow the surges of glaciers in Svalbard, as this allows the detection of individual surface features, that then allow Adrian to produce up-to-date glacier velocity maps for the whole of Svalbard. SAR is perfect for feature tracking, because it has good repeat image reliability, can see through clouds (Svalbard is very cloudy!), features can be tracked throughout the polar night and the illumination geometry is constant.
Tunabreen – its current surge has been tracked throughout the polar night using SAR and feature tracking
Visiting a surge-type glacier – Tunabreen
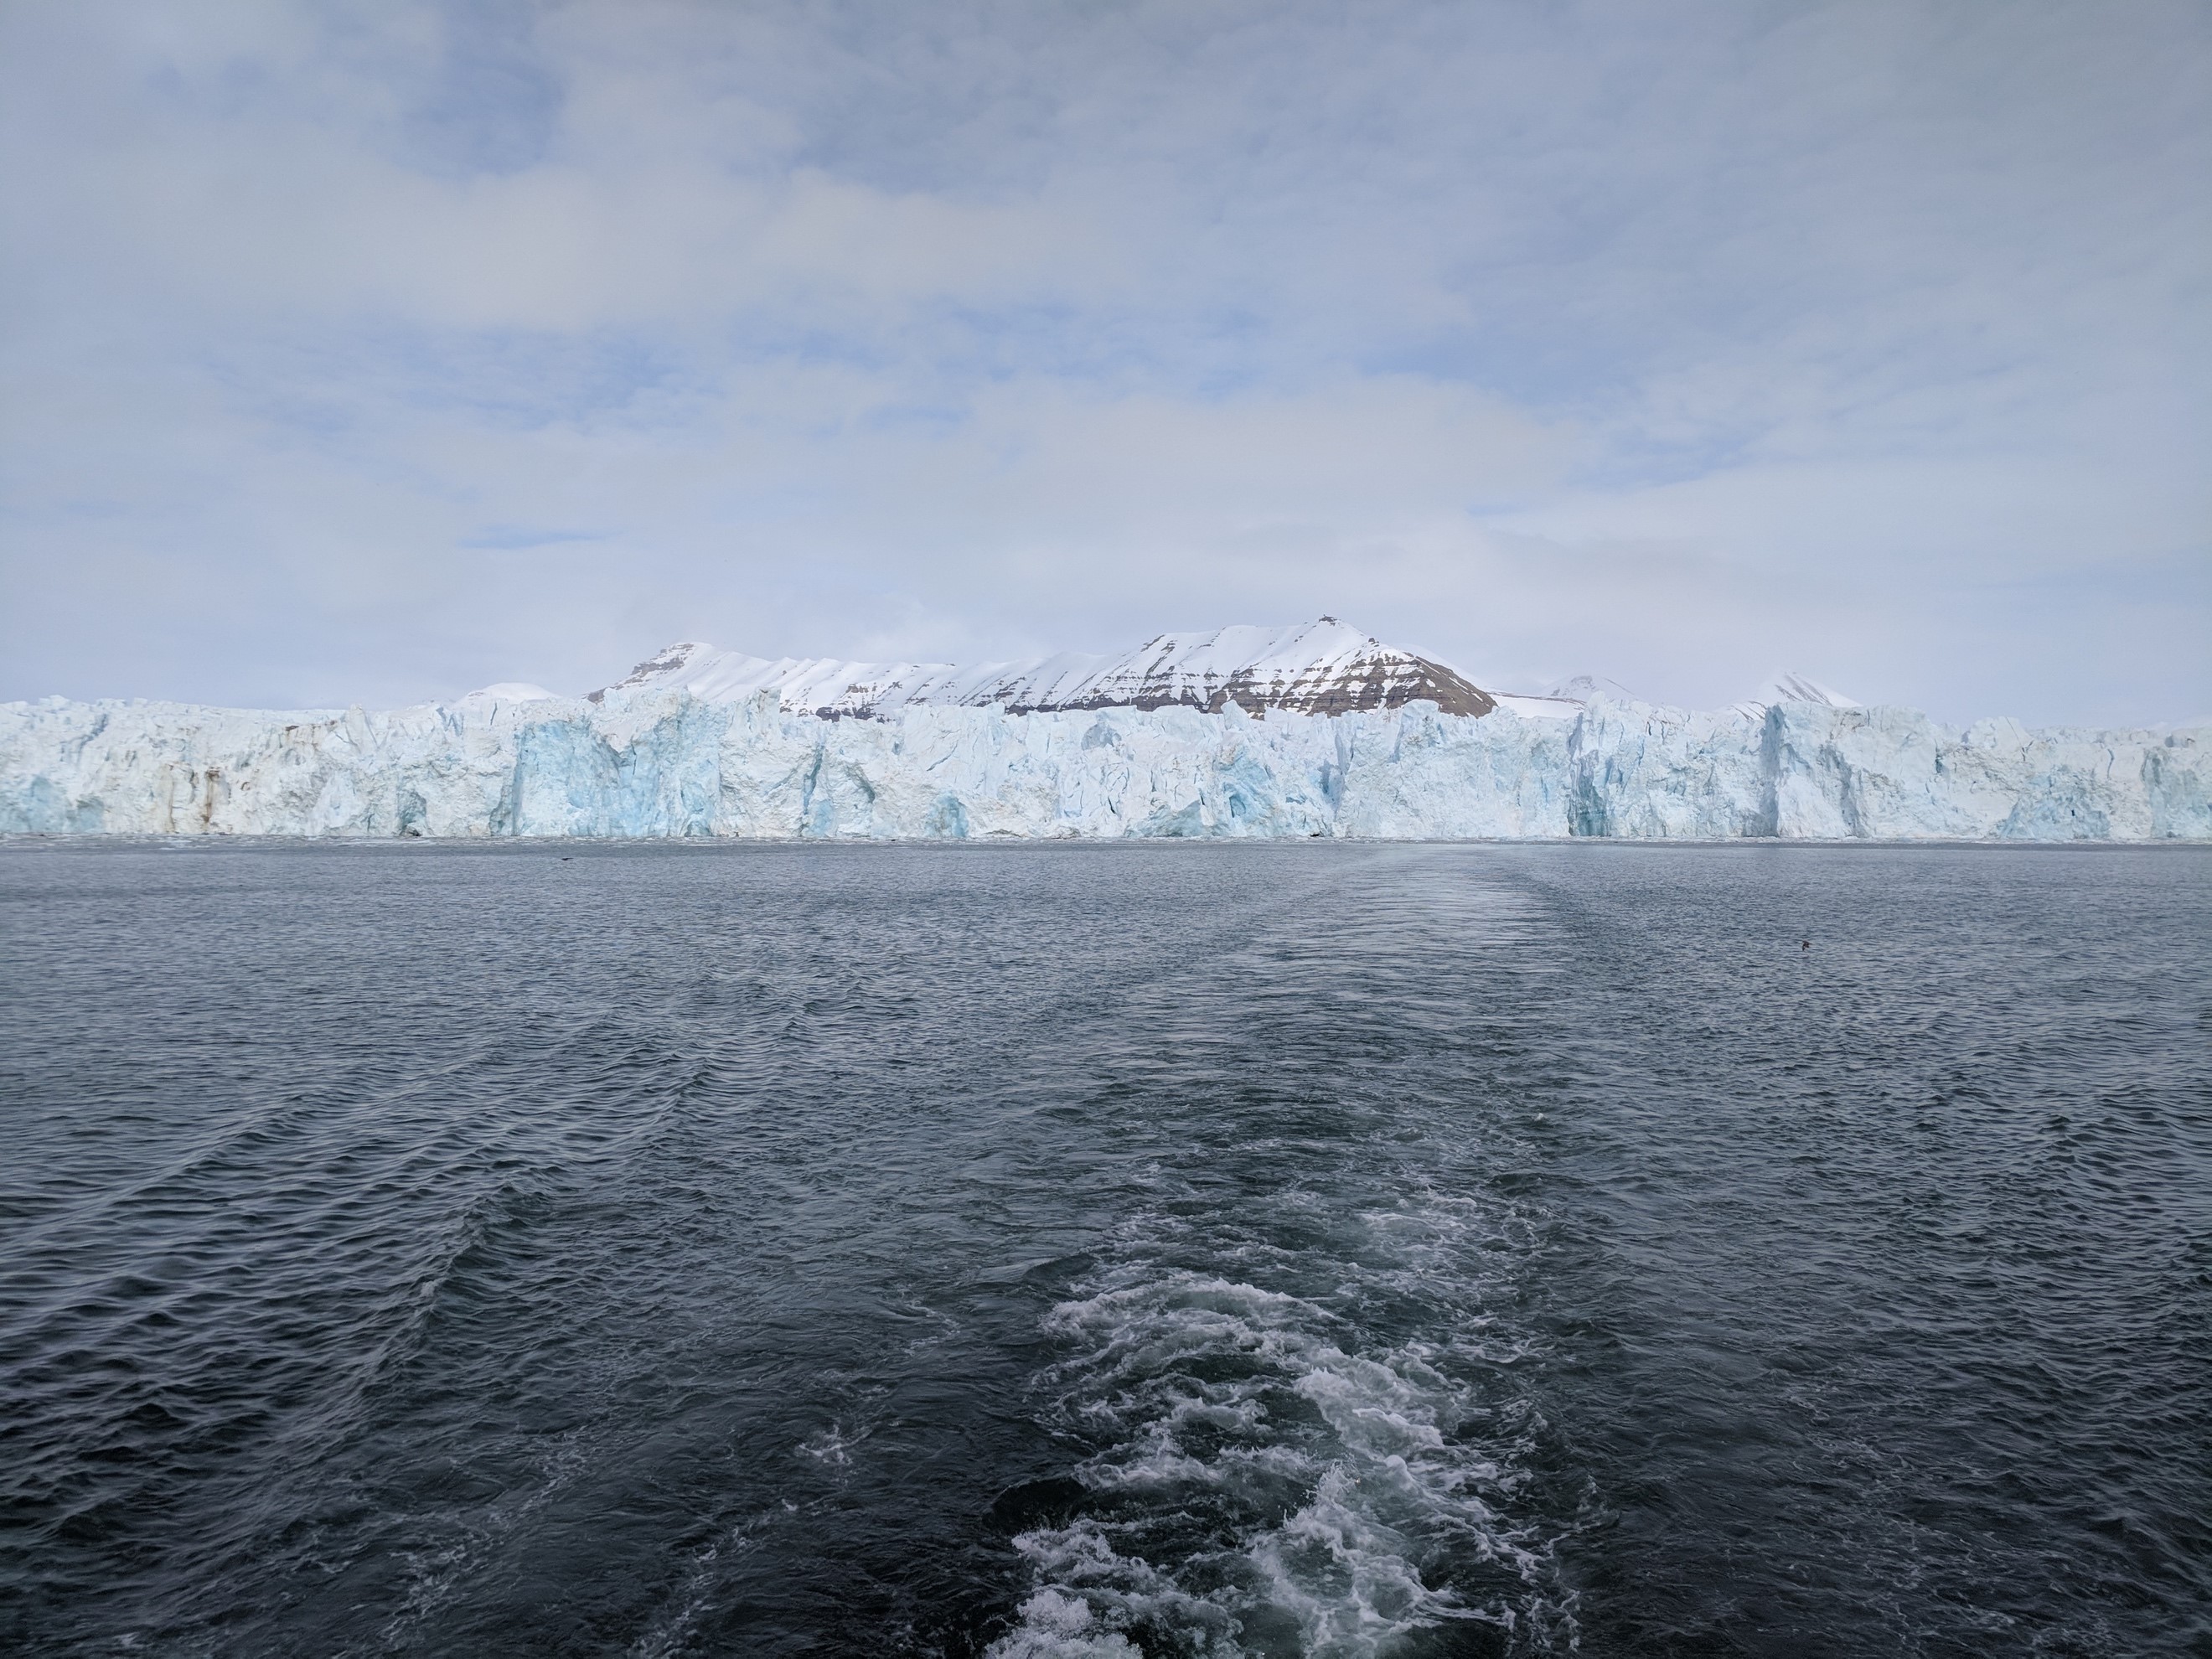
Any remote sensing researcher knows the importance of ground-truthing our data – to make sure that what we see from space matches what is actually happening on the ground. So, being good all-round researchers, we had to see a glacier in all its glory! 55 km from Longyearbyen is the surge-type glacier Tunabreen. Since late-2016, Tunabreen has advanced around 1.2 km. This is not an unusual phenomenon, but Tunabreen has been observed for 4 full surge cycles now – reaching a peak surge in 1870, 1930, 1971 and 2004. This makes the current surge unexpectedly early. In 2016, the region was hit with a series of short, but intense, precipitation events that also led to landslide events in Longyearbyen. One theory is that the current surge of Tunabreen was also caused by this precipitation event, and there are signs that the surge is beginning to slow. Whatever is going on here, it made for a very beautiful trip!
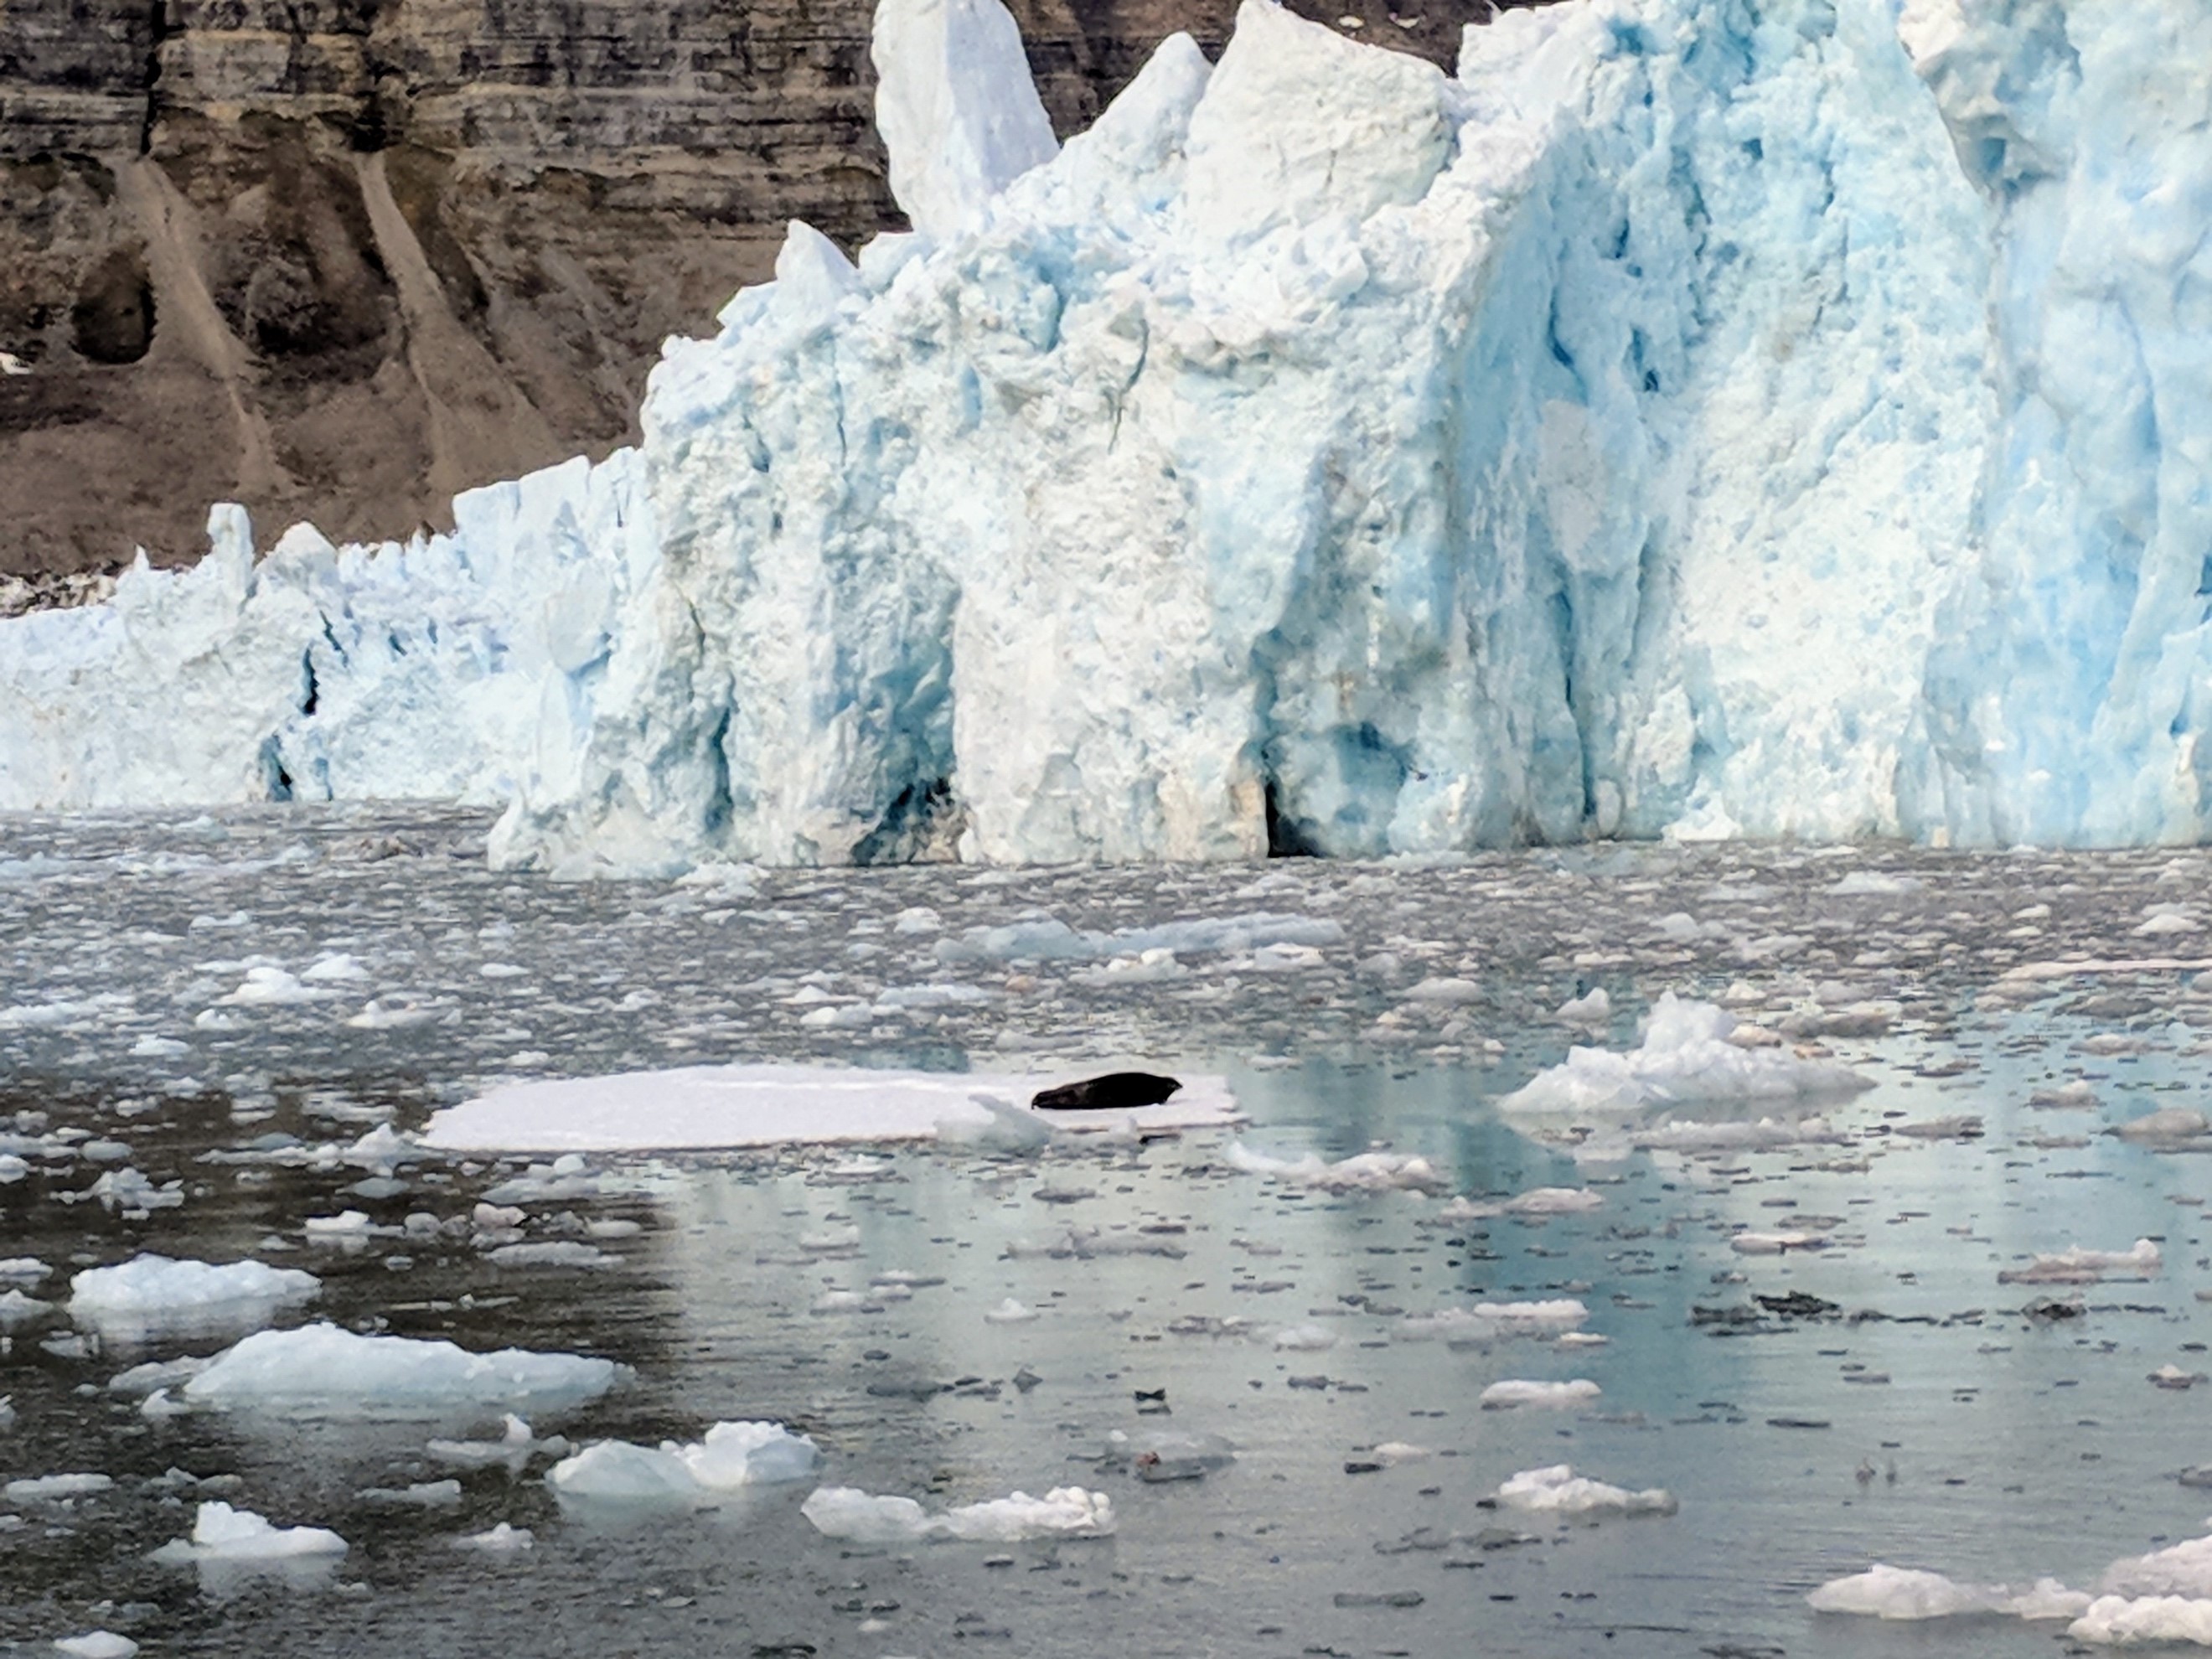
Tunabreen’s calving front – Seal for scale!
Optical remote sensing of the cryosphere
Landsat-8 is an optical satellite, and is very useful to study the cryosphere. It is especially important in land cover mapping. Using Landsat-8, it is possible to identify different species of moss growing in Arctic peatlands, reindeer grazing pastures and the migration of supraglacial lakes up-glacier. The NASA GoLive project uses Landsat-8 data to provide live velocity maps of glacial regions using feature tracking. At UNIS, we used optical data from Sentinel-2 and the difference in the spectral signature of bands to classify glacial regions; clean-ice, dirty-ice, clouds etc. It was all going well, until we hit the problem of shadows, but optimising our band ratios and thresholds (and adding a bit of blue band) helped us create accurate measures of glaciers in Svalbard, even when covered by debris.
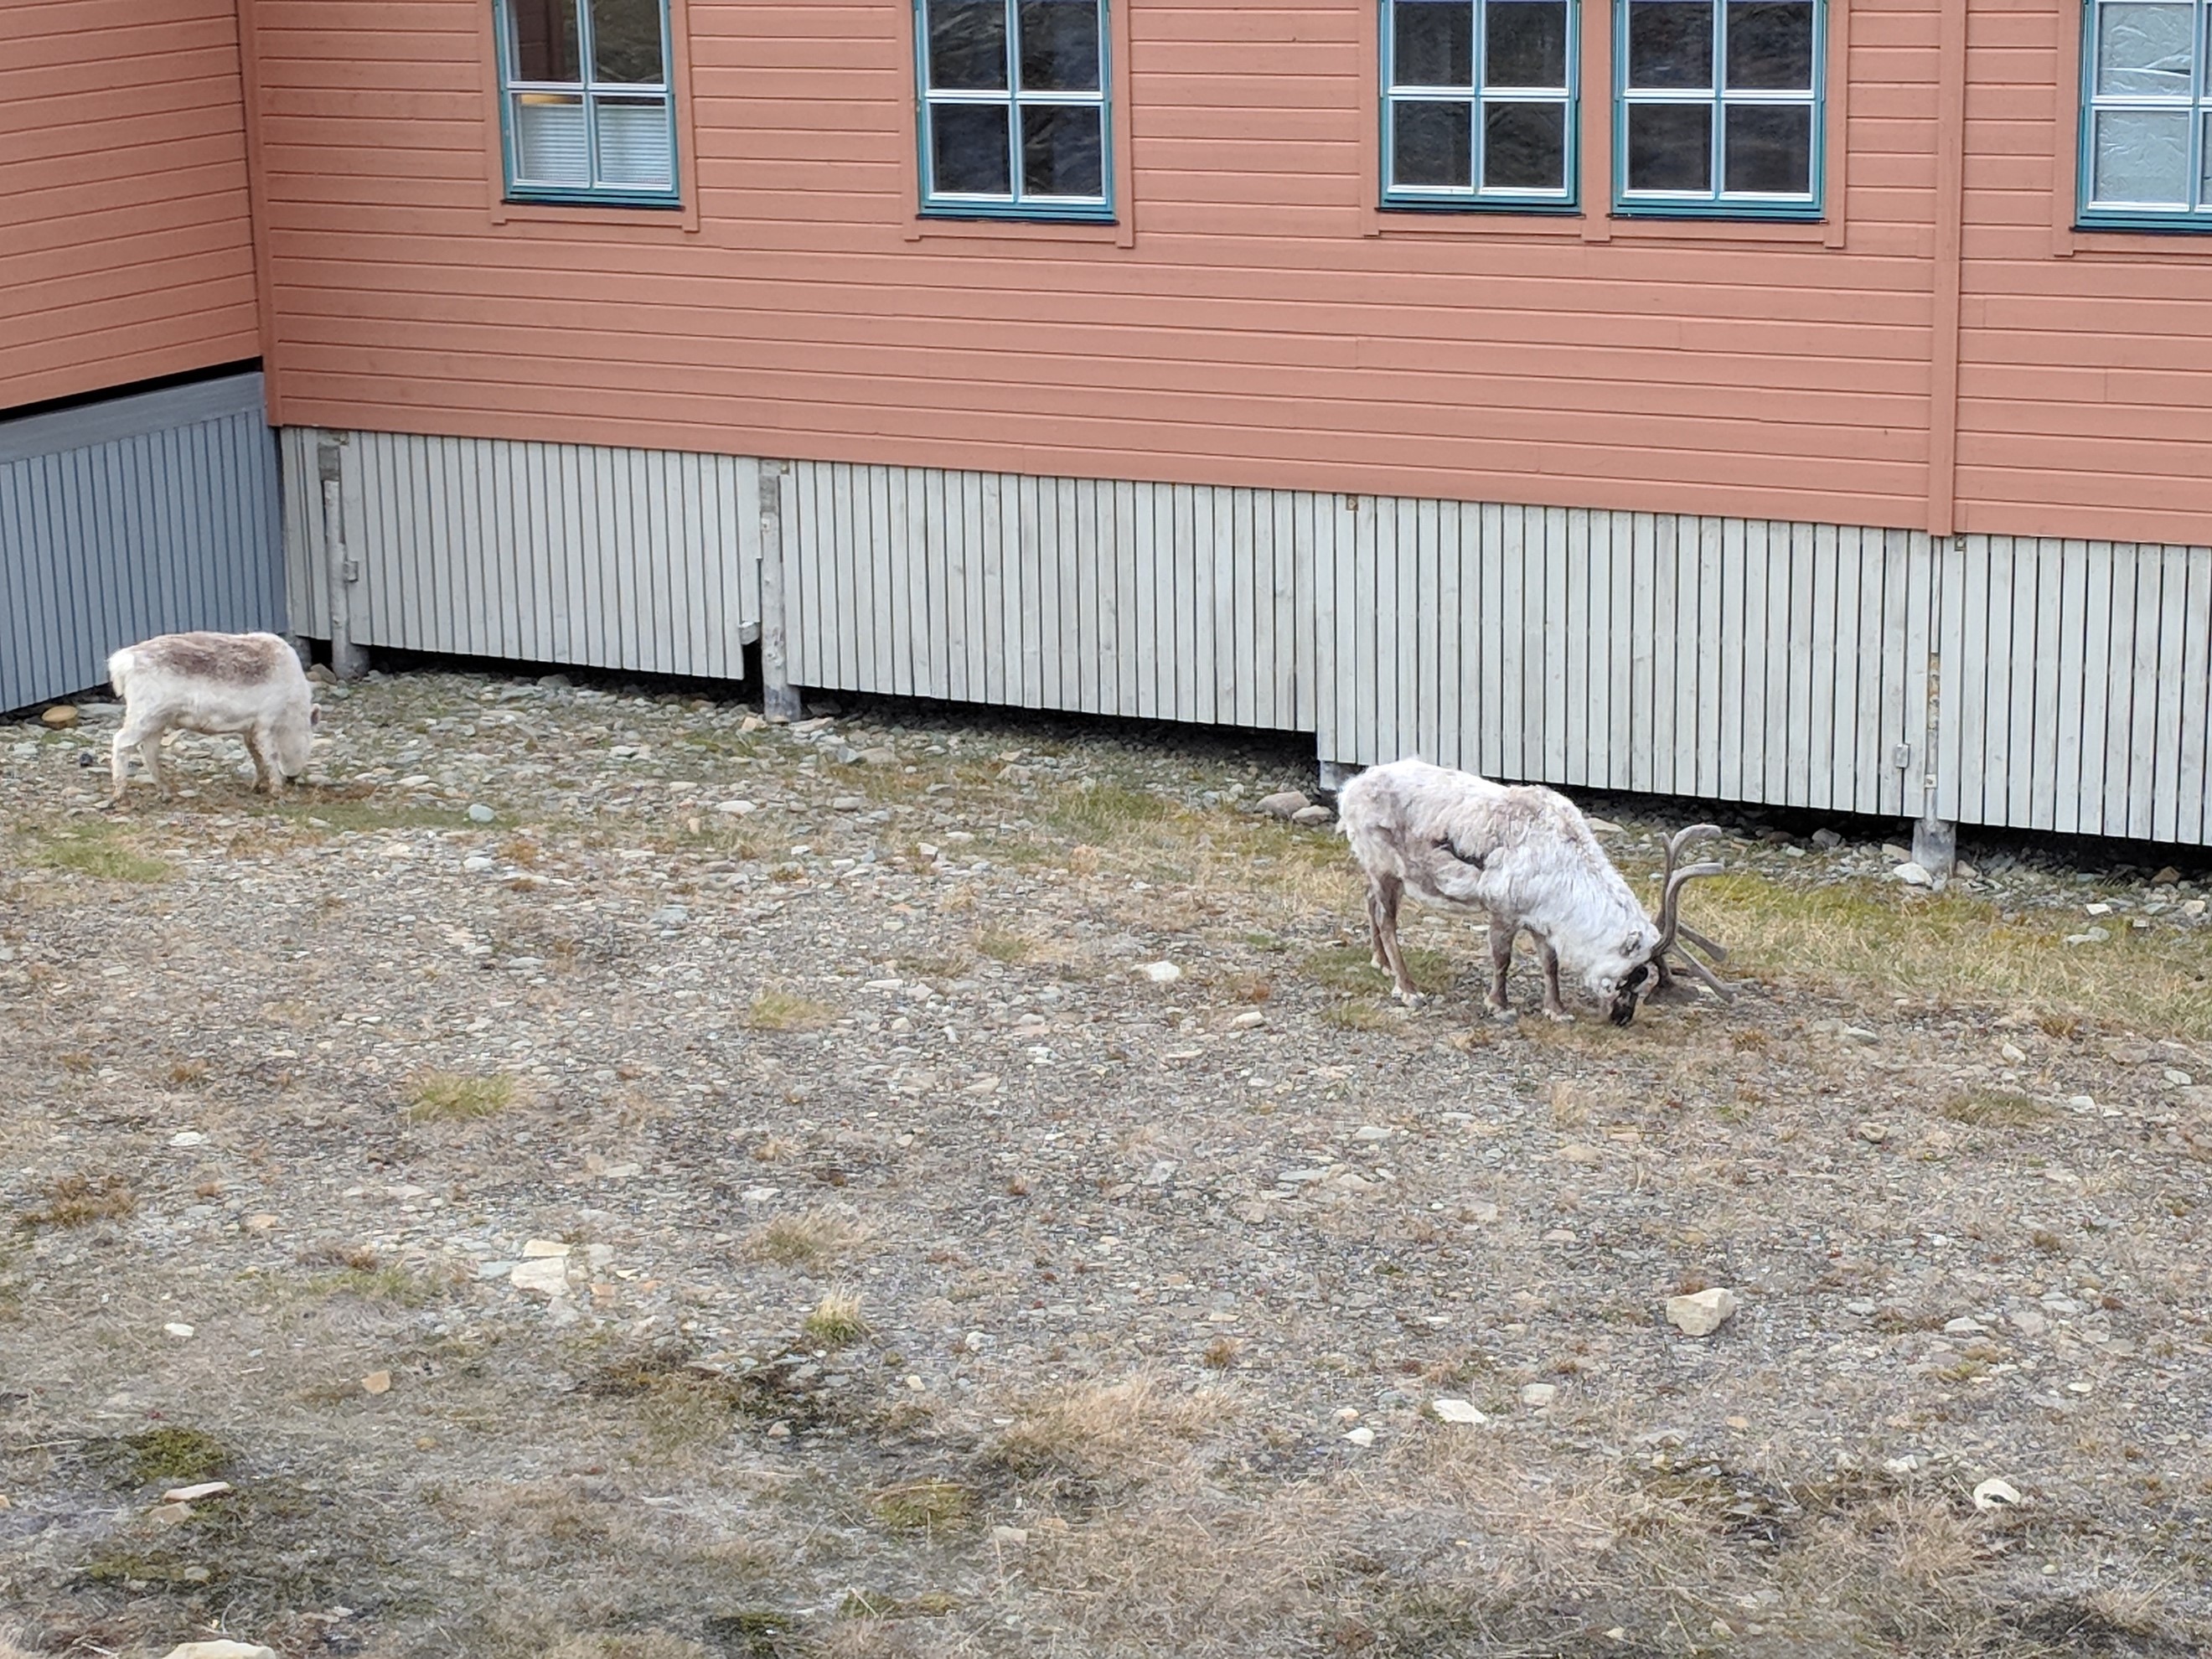
Reindeer are found across Longyearbyen and are a big part of the community. While these are perfectly happy staying in the town, Landsat-8 can follow the migration of their distant cousins
Gravimetry
Gravimetry is the study of the Earth’s gravitational field. The GRavity And Climate Experiment (GRACE) mission, run by NASA, measures changes in the Earth’s gravitational field over time. Essentially, it weighs the Earth repeatedly. While GPS and altimetry are able to give a good indication of local-scale change, GRACE’s selling point is that it is great for giving a broad, regional scale picture of mass loss. Interestingly, outside of the cryosphere, GRACE also detects rainfall patterns across the Amazon – detectable because of the vast amount of water that is deposited seasonally. In this GIF from NASA, you can see increasing mass loss from Greenland as well as those seasonal changes in the Amazon.
And much much more!
This blog could easily be 10,000 words longer. We learned so much, about how every combination of remote sensing instruments and techniques are being used to monitor the changing cryosphere. Upcoming missions (IceSat-2, Sentinel-3c, Sentinel-6 etc.) will advance our understanding of the dynamics of sea-ice, land-ice, permafrost, cryospheric hazards, mountain glaciers, frozen ground and much more. It is a very exciting time to be remote sensing in the cryosphere.
I’d like to extend massive thanks to the European Space Agency for the opportunity of a lifetime to learn as part of the Cryosphere Training Course. Also, to UNIS for your hospitality and warm(!) welcome to the Arctic.
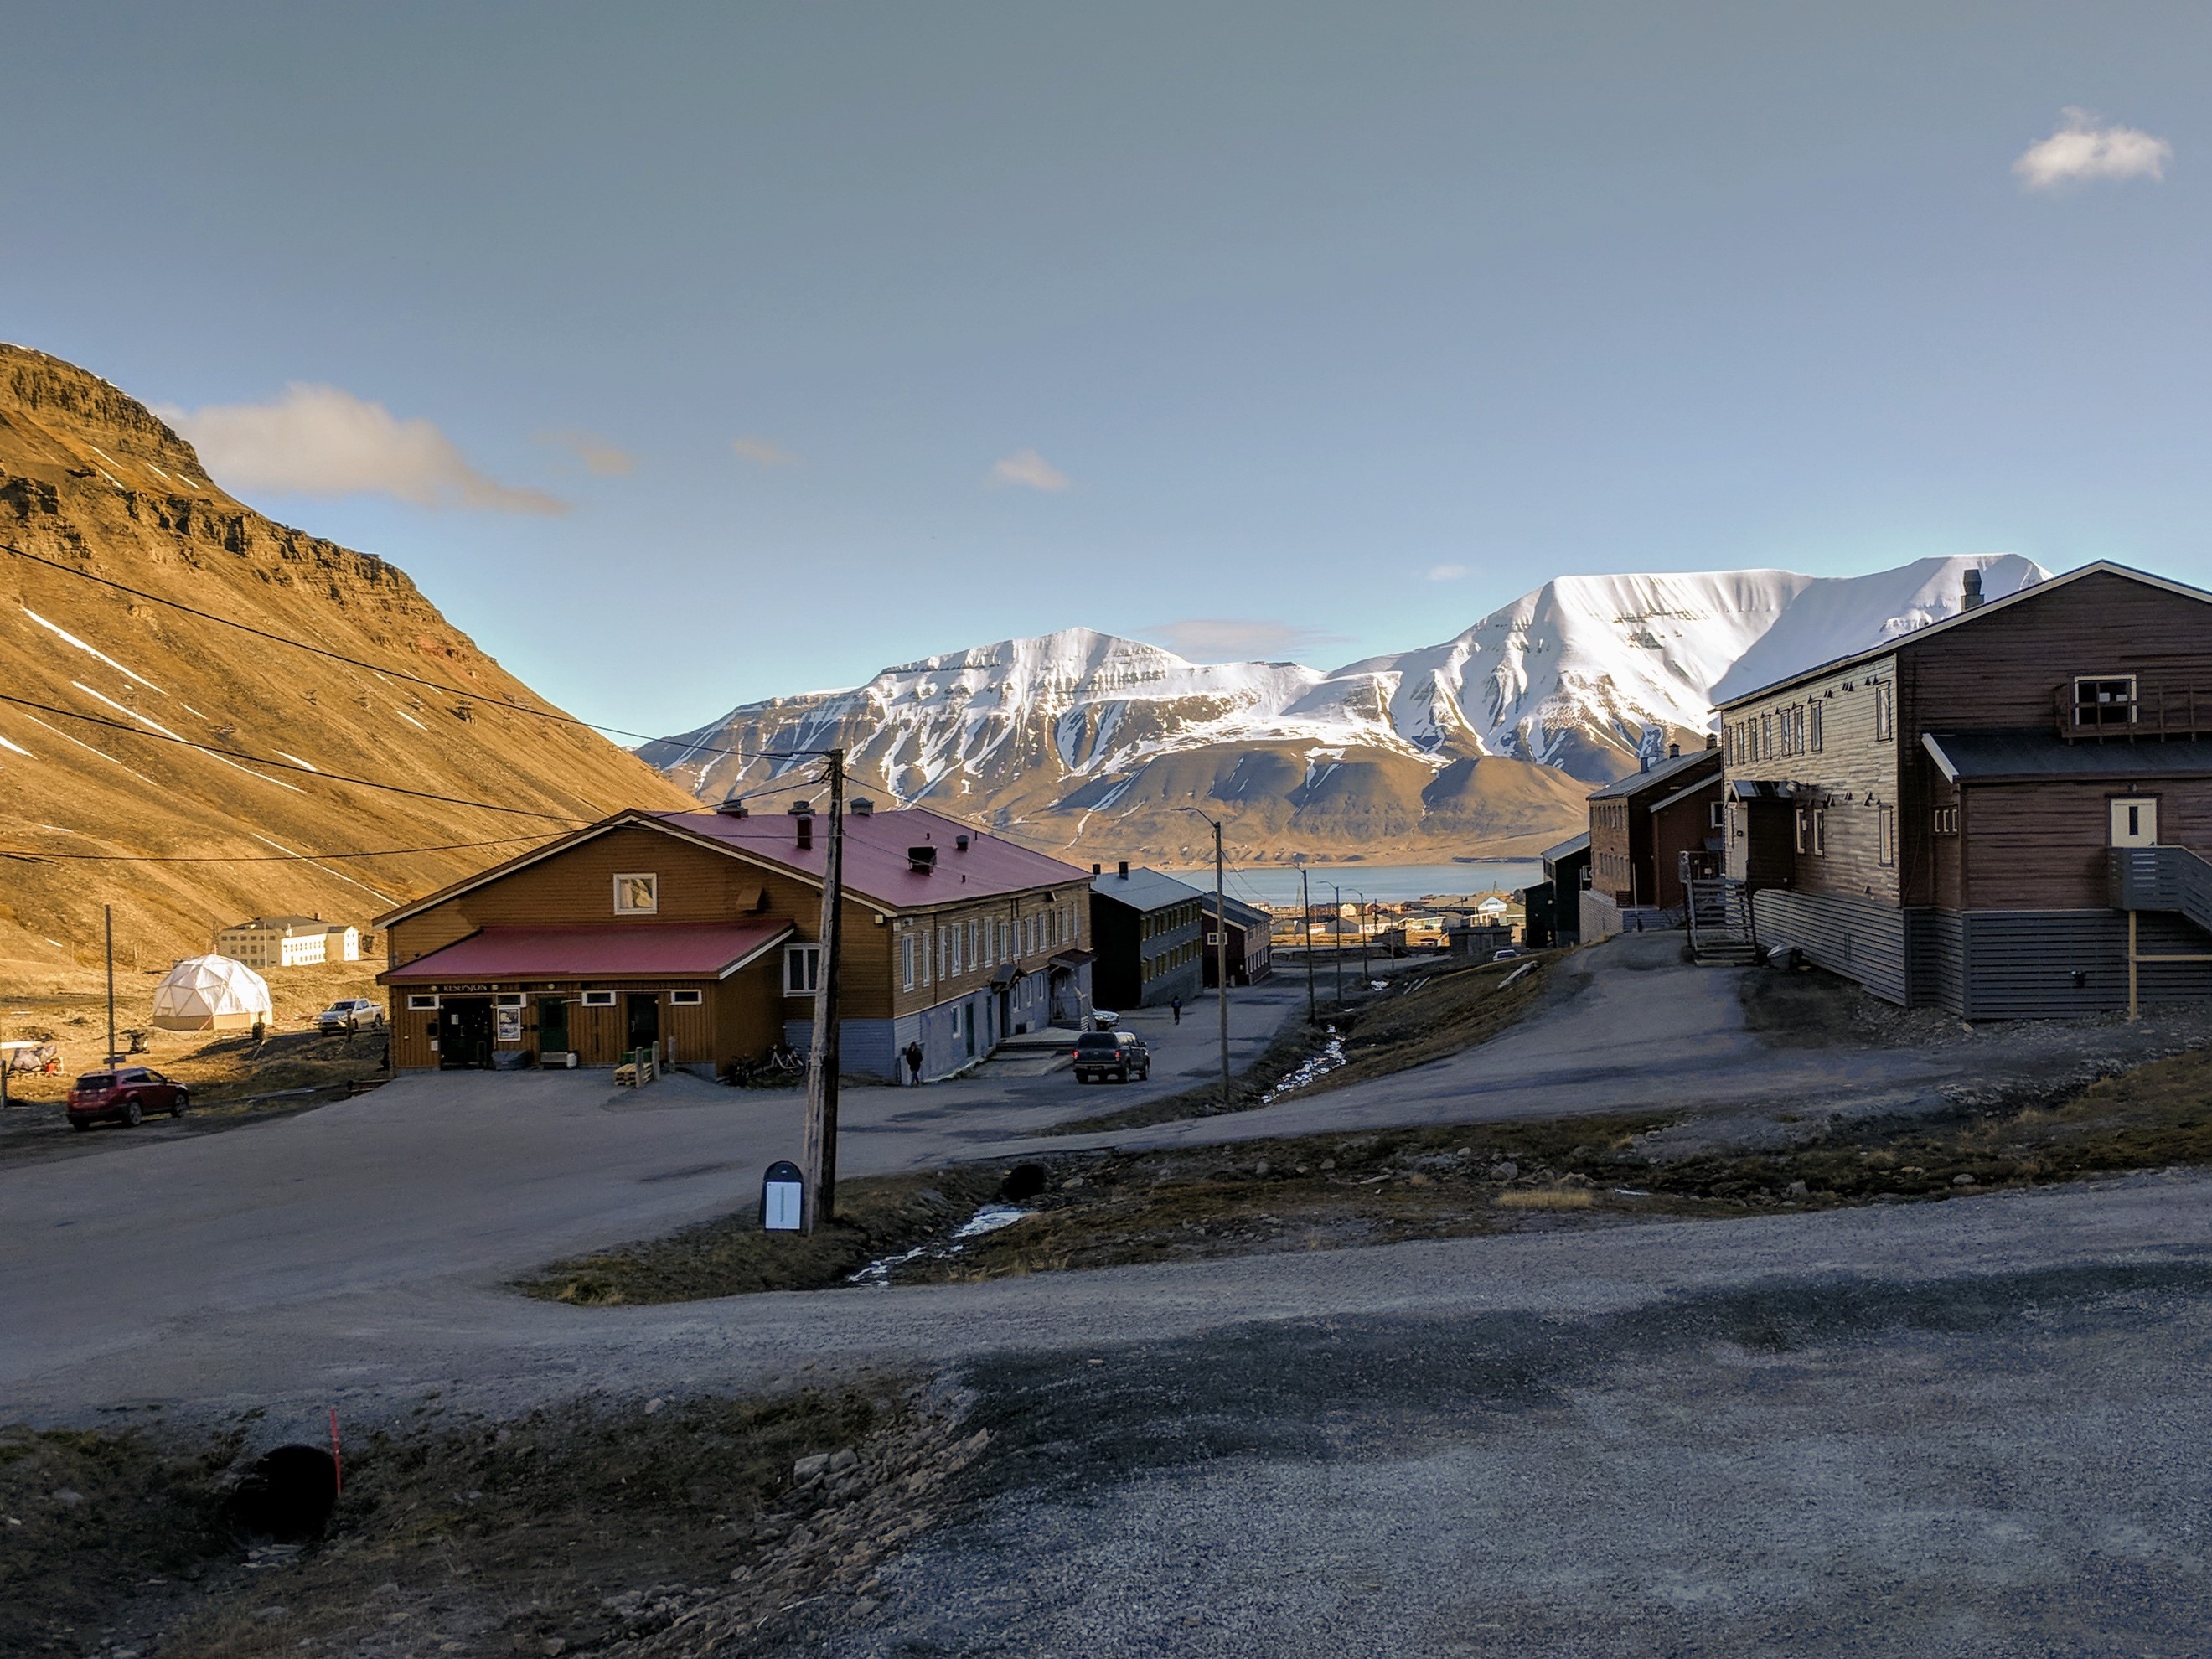
Final walk to UNIS on my last day in the Arctic! We stayed in former mining barracks around 2 km from the main town of Longyearbyen. Mining shaped the town and remains a big part of the local economy today
.