Ice thickness changes in Antarctica and their
consequences for global sea level
Duncan Wingham and Andrew Shepherd
Antarctica: Growing or Shrinking?
It has been remarked that the oldest scientific question in connection with the Antarctic ice sheet is whether it is growing or shrinking. For decades the question has been regarded as open. As recently as 1992 a systematic accounting of the known mass fluxes concluded that the direct glaciological evidence would allow the ice sheet to range from a 600 Gt/yr source to a 600 Gt/yr sink of ocean water mass. Indirect evidence is also ambiguous: the 20th century rise global sea level is easier to explain with a 360 Gt/yr contribution from the Antarctic ice sheet; on the other hand a body of relative sea level and geodetic evidence prefers the notion that the mass exchange with the ocean is close to zero, at least on the millenial scale, and in particular suggests that the Holocene deglaciation was substantially complete several thousand years ago. The limited observations are also unable to confirm or dismiss theoretical speculation that small changes in the West Antarctic Ice Sheet may lead to its widespread ‘collapse’
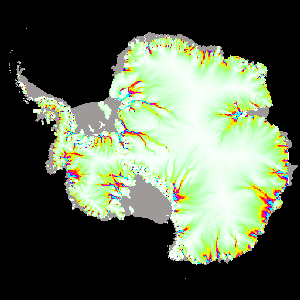
The vast majority of ice discharge from the Antarctic Ice Sheet is drained through a handful of fast moving ice-streams and outlet glaciers that are fed by relatively inactive catchment areas. A snapshot of ice-sheet elevation data derived from the ERS radar altimeter reveals the intricate pattern of these ice flows (right).This map of Antarctic balance velocities shows giant rivers of ice, up to 1000 kilometres in length, flowing from the interior of the ice sheet to the sea.
ERS: A decade of measurements
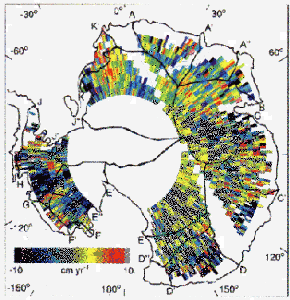
The 10-year series of observations by the ERS satellites is beginning to shed new light on the state of the Antarctic Ice Sheet, and the consequent impact upon global sea levels. The precision with which we can now make satellite measurements allows us to see the internal changes for the first time. Long time-series of ERS radar altimeter measurements (left) show that the average elevation of the Antarctic Ice Sheet interior fell by 0.9 +/- 0.5 centimetres per year from 1992 to 1996 (Science, October 1998). Allowing for natural variations in snowfall, the imbalance of the ice sheet interior this century is only 0.06 +/- 0.08 of the mean accumulation rate. At most, Antarctica has had only a modest (+/- 1-2 mm) impact upon global sea levels this century. Extending this time-series of elevation change using future generations of satellite altimeters (e.g. ENVISAT, CryoSat) will reveal more subtle flow features and changes in the ice-sheet morphology.
Western Antarctica: Dynamic thinning
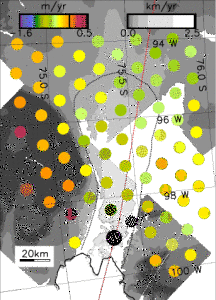
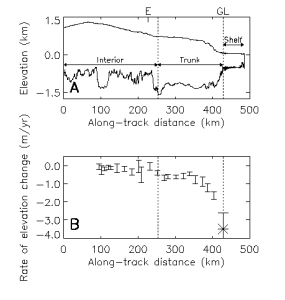
We have shown, through close examination of altimeter measurements (e.g. Science, February 2001 ) that widespread inland thinning of the ice is occurring in the Amundsen Sea sector of the WAIS (right), and correlation of its spatial pattern with the flow of ice (b/w contours) determined using satellite radar interferometry (SRI) leads to the view that the thinning has a time scale associated with ice dynamics. Close examination of the point of flotation of the ice and its velocity using SRI has shown that the ~ 100 Gt yr-1 of ice hitherto thought on the basis of glaciological measurements to be accumulating in the E. Antarctic interior is in fact being lost to the ocean through basal melting, in keeping with the altimeter observations that find no detectable change in the grounded East Antarctic ice sheet. In summary, the 20th century Antarctic mass imbalance looks distinctly more negative than was previously thought, easing the problem of closing the 20th century sea level budget and the newly recognised importance of ice shelf melting emphasises mechanisms that may allow a warming ocean to offset the expected 21st century growth due to increased precipitation from the warming atmosphere.
Antarctica: The future
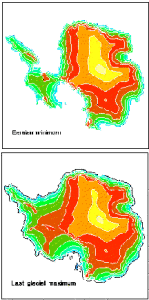
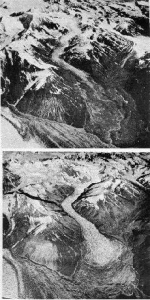
The presumably long-lived thinning observed in West Antarctica (below) raises the important question as to the past and future evolution of the ice sheet. Is the thinning seen in West Antarctica a sign of its continued deglaciation (below left) or the result of more recent event such as the collapse of an ice-shelf (below centre) or a glacier surge (below right)? Whatever the case, will the thinning accelerate? A feature of the newly observed changes is that they are not captured by present-day computer models of the ice sheet evolution, almost certainly because the thinning depends on poorly known ‘mesoscale’ processes and geometry at the bed. Given that the Amundsen Sea sector of WAIS alone contains a water mass equivalent to 1.1 m of eustatic sea level, and that there are at least theoretical arguments as to why the thinning may accelerate, this present inability to capture the largest on-going changes in the inland Antarctic ice sheet is perhaps a matter of concern.

