
By Mal McMillan, University Academic Research Fellow, Leeds
For the last few years my research has focused on the Arctic, and most recently the Greenland Ice Sheet. This represents a bit of an excursion away from my PhD and postdoc home, which was firmly rooted in Antarctica. It’s a foray that I’ve found both interesting and challenging, and hopefully one that has proved worthwhile.
The Greenland Ice Sheet is, in my opinion, one of the most amazing places on Earth. It first captured my imagination about 15 years ago, during an expedition to climb Shackleton Bjerg in North East Greenland. I was blown away by the sheer scale and beauty of the place; its immense and vast wilderness was unlike anything I had experienced before.
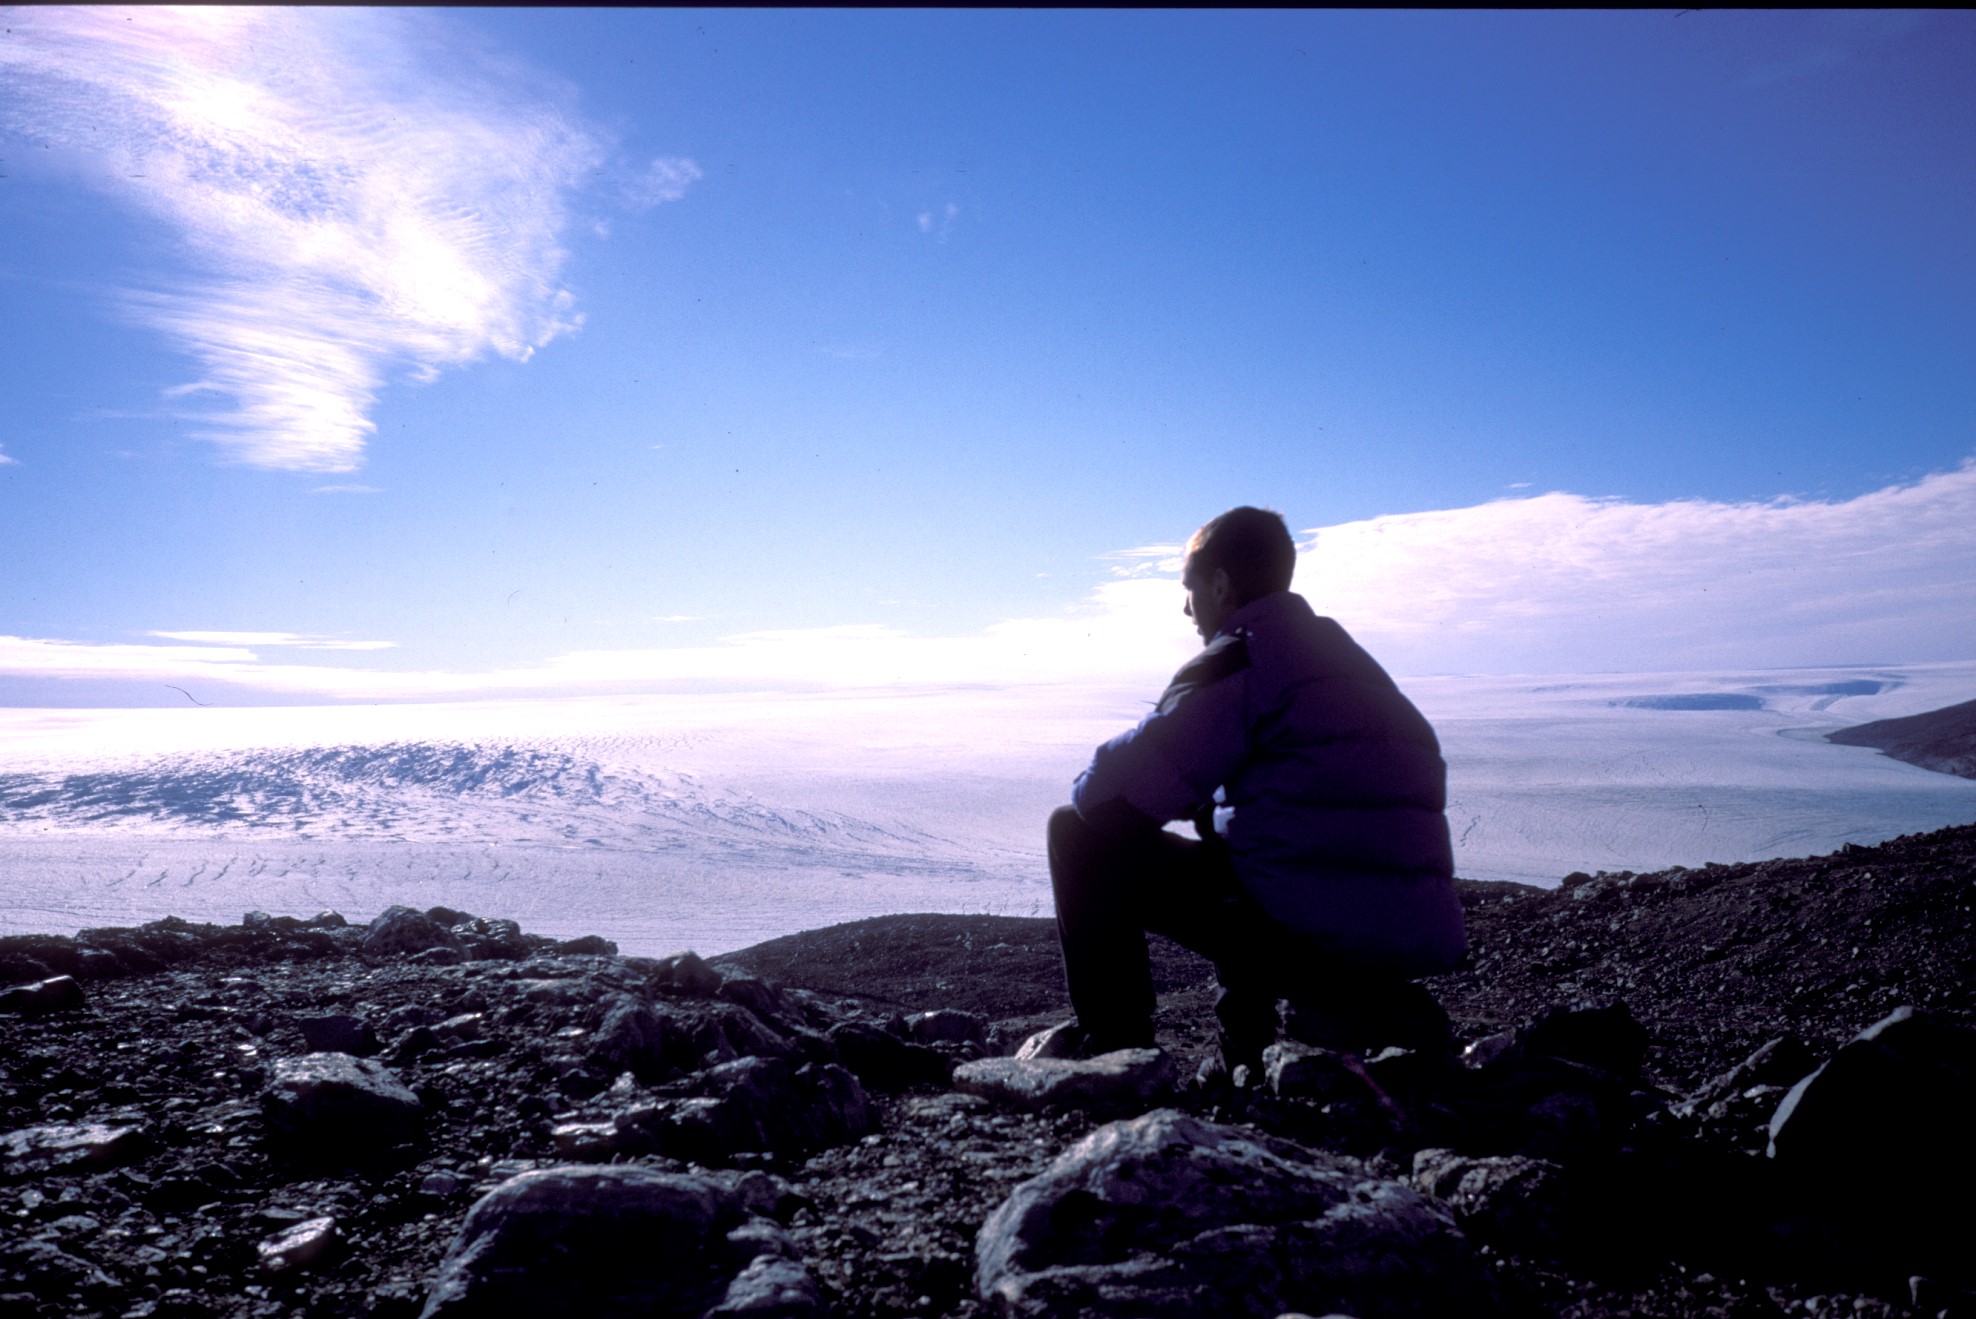
Inspired by an ice sheet, North East Greenland
Fast-forward to the present day and I now study the ice sheet from a more distant perspective. I use the technique of satellite altimetry (see Kate’s post from a few weeks back) and my satellite of choice has been CryoSat-2.
At present it’s a really interesting time to be working with the current generation of altimetry satellites. Recent advances in the technology that they carry, together with the development of more sophisticated processing techniques, is enabling a transition to an era of new, high resolution data. This, in turn, is opening up novel areas of research and giving us new insight into how Earth’s polar regions are changing.
For the last couple of years, I have been using CryoSat-2 to monitor the Greenland Ice Sheet. The types of questions I have been interested in trying to address are:
- What contribution is Greenland currently making to global sea level?
- How does this contribution vary from year to year, and from region to region?
- What processes are responsible for this spatial and temporal variability?
I am also interested in trying to better understand the factors affecting the performance of current satellites, and how we can improve the data processing methods that we use. Ultimately, the aim is to develop systematic, long-term records of Earth’s polar regions, which can be used by the modeling community to better understand how ice sheets respond to climate change (click on picture below to enlarge).
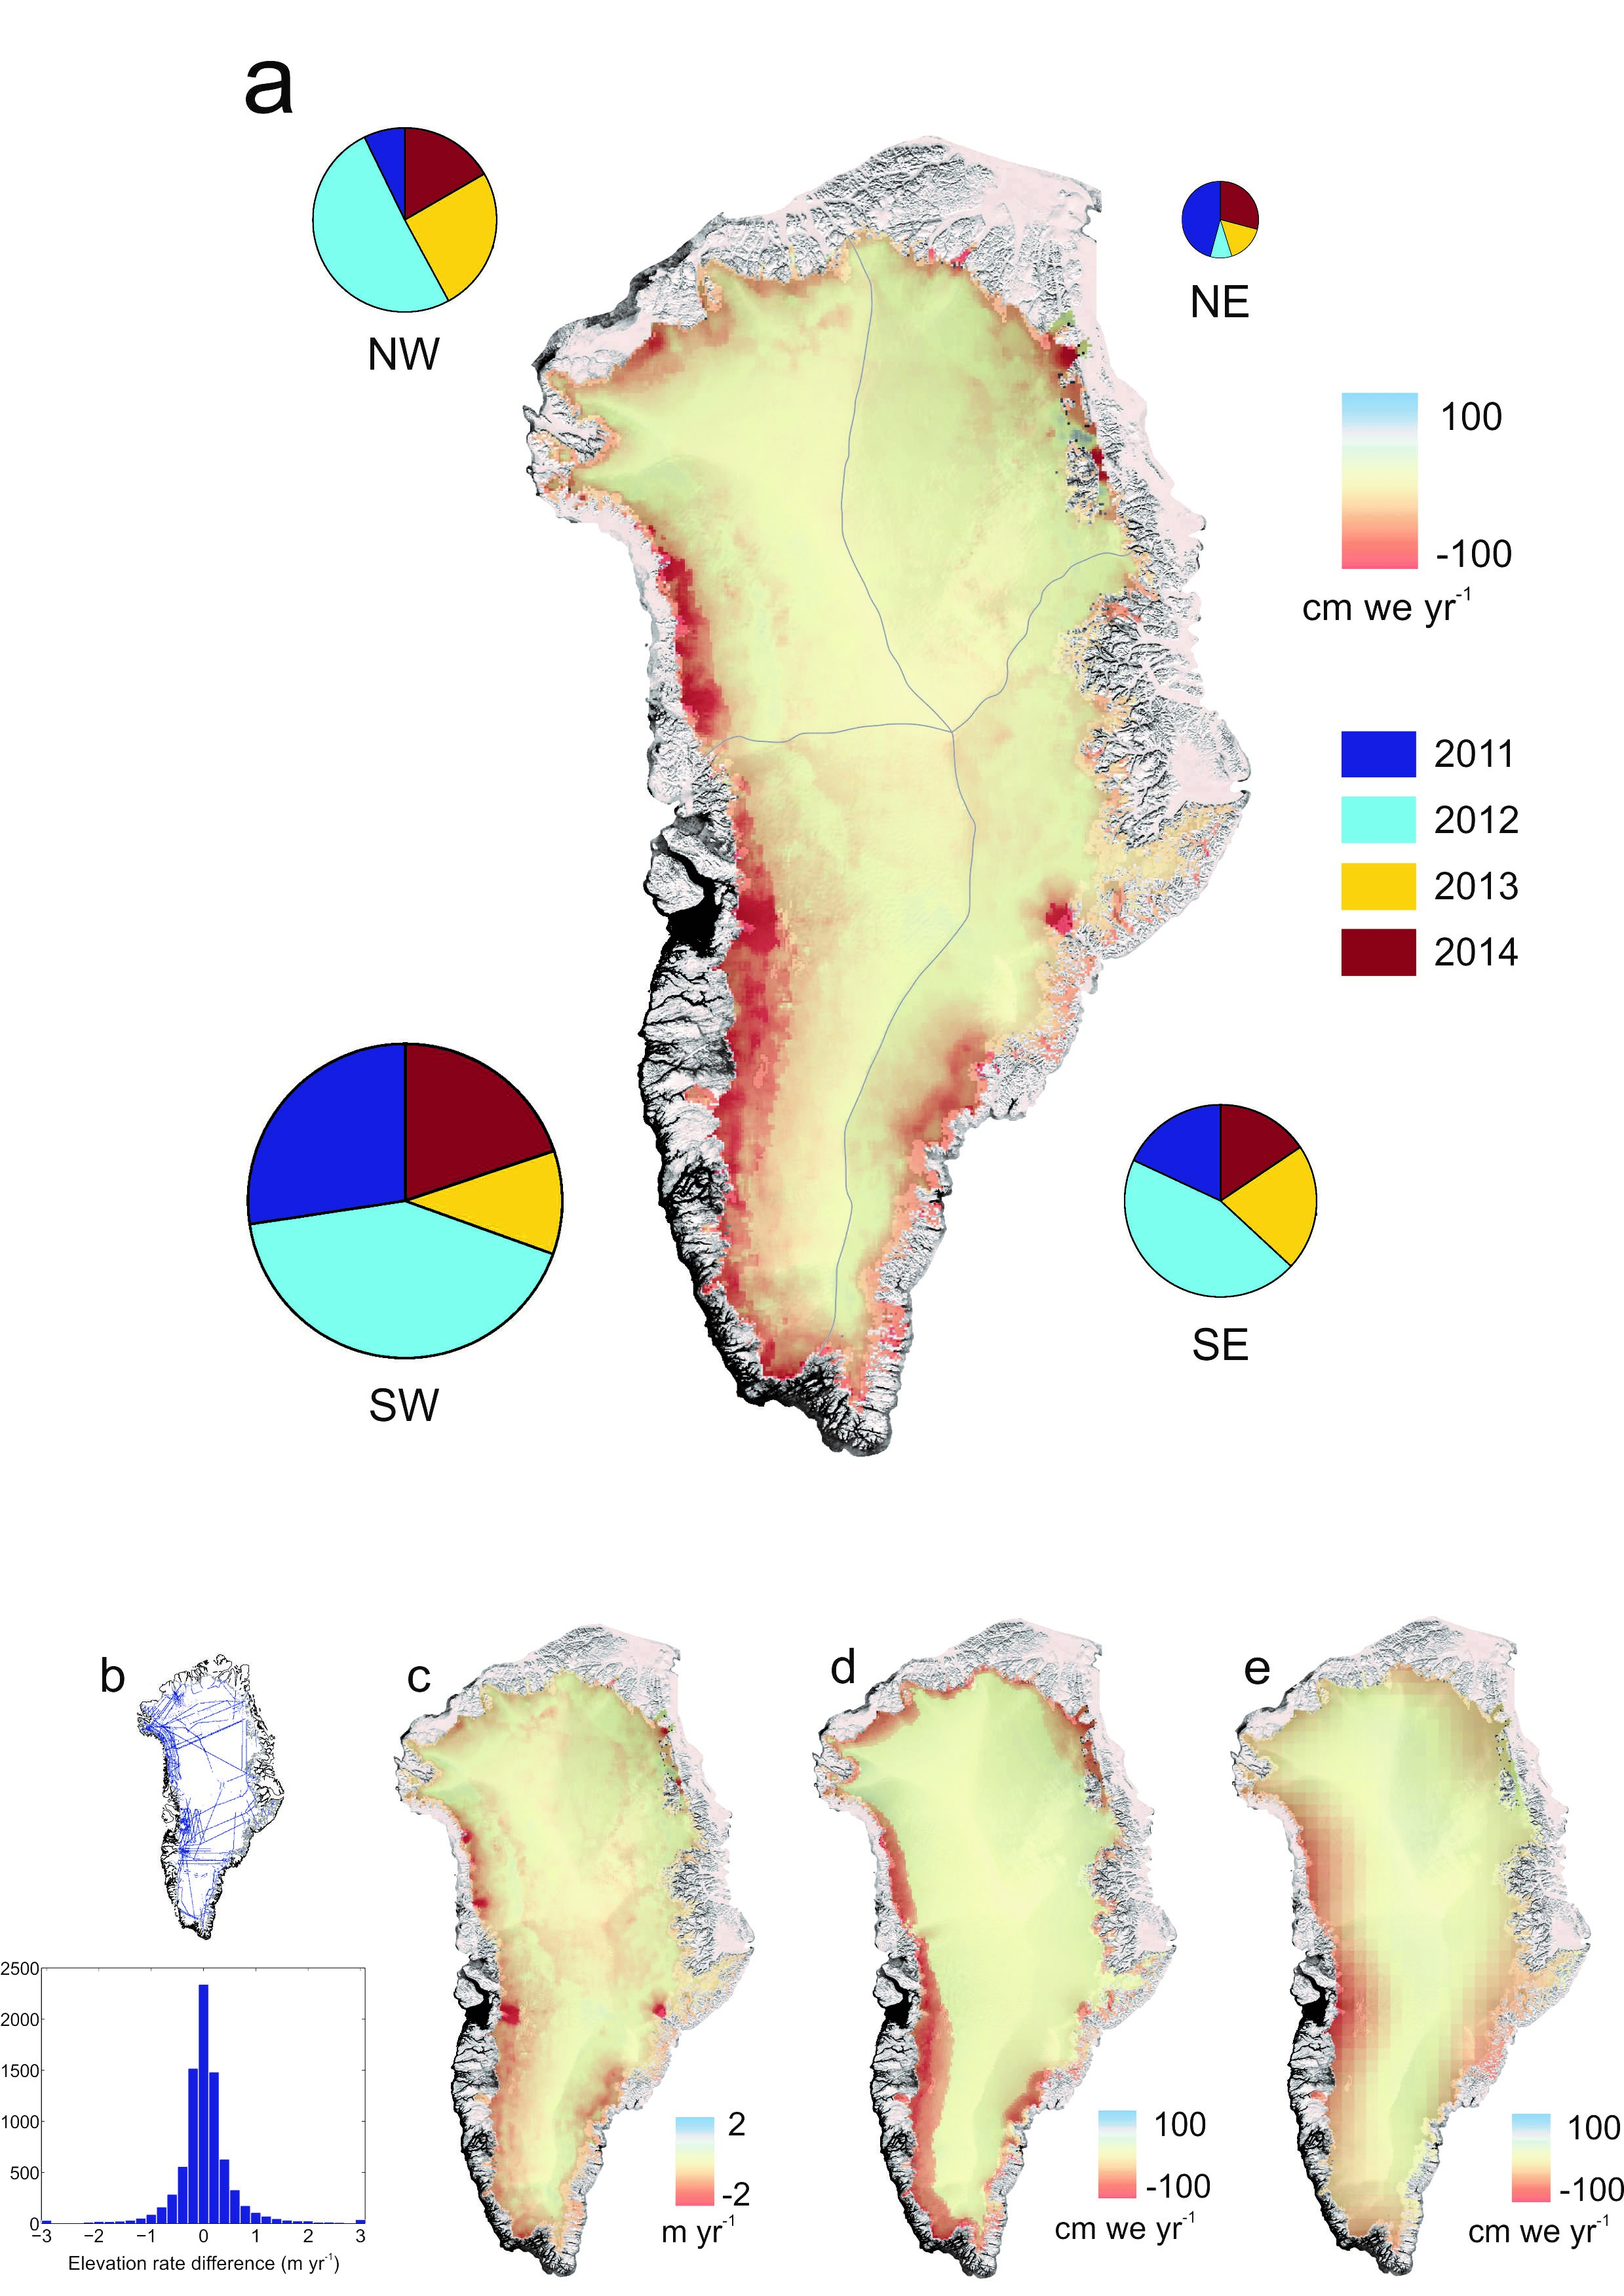
Greenland mass loss, 2011-2014, recorded by CryoSat-2. Credit: CPOM/GRL/Wiley publishing
Like a lot of science, this work has turned out to be quite a collaborative business; working with a single source of data rarely allows you to answer all the questions, and much more is gained by drawing on the expertise of other research groups.
In this work on Greenland, I have been collaborating with scientists from the Institute of Marine and Atmospheric Research in the Netherlands, and from the Universities of UCL, Lancaster and Dresden. Through these collaborations we have been able to better understand the signals we see in the altimetry results, and also check that they are consistent with other, independent sources of data.
So, enough background. What have we actually learnt from this work about the current health of the ice sheet? Well, since 2010, Greenland has lost about 270 billion tonnes of ice each year, which has added around 0.74 mm annually to global sea level. This is about twice the average rate we have observed over the past two decades, and maintains the record of the preceding 5 years.
We have also recorded large variations in the amount of ice lost each year, depending upon the intensity of summer melting, and found that ice loss has varied greatly between regions, as individual glaciers behave in very different ways.
So what are the broader implications? Well apart from the obvious, that Greenland continues to make a substantial contribution to global sea level, these observations highlight the complexity of the interactions between the ice sheet and its surrounding environment.
Given the increasing rates of ice loss that have been recorded in the last two decades, and the prospect of future temperature rises across Earth’s polar regions, the need for sustained and systematic monitoring programmes is, to me at least, clear. Hopefully, with the continued operation of CryoSat-2, together with exciting new satellites coming online, such as ESA’s Sentinel-3 and NASA’s ICESat-2 we will be able to continue these valuable records.