The UKRI have awarded £47M to NERC research centres to address six critical environmental science challenges facing the UK, including climate change mitigation strategies, coastal flooding & erosion, and extreme weather.
CPOM is to collaborate on 3 projects BIOPOLE, CANARI & TerraFIRMA.
Biogeochemical processes and ecosystem function in a changing polar system (BIOPOLE), £9 million
Led by the British Antarctic Survey, in collaboration with:
British Geological Survey
Centre for Polar Observation and Modelling
National Oceanography Centre
UK Centre for Ecology & Hydrology.
Project partners include:
Alfred Wegener Institute, Germany
Helmholtz Centre for Polar and Marine Research, Germany
University of Alaska Fairbanks, USA
University of Alberta, Canada
University of Bristol, UK
University Centre in Svalbard, Norway.
Climate change is proceeding faster at the poles than any other region, resulting in sea ice loss and glacial melting.
There is a clear urgency in understanding the full implications of these changes for the polar regions themselves and for the wider Earth system.
BIOPOLE will provide a step change in the knowledge and predictive capability concerning how polar ecosystems regulate the chemical balance of the world’s oceans and, through it, their effect on global fish stocks and carbon storage.
Climate change in the Arctic-North Atlantic region and impact on the UK (CANARI), £12 million
Led by the National Centre for Atmospheric Science, in collaboration with:
British Antarctic Survey
British Geological Survey
Centre for Polar Observation and Modelling
National Centre for Earth Observation
National Oceanography Centre
UK Centre for Ecology & Hydrology.
The project partner is the Met Office Hadley Centre, UK.
The weather and climate of the UK is shaped by the large-scale circulation of the atmosphere and ocean in the North Atlantic.
This project will advance understanding of the impacts on the UK arising from climate variability and change in the Arctic-North Atlantic region. It will focus on extreme weather and the potential for rapid, disruptive change.
This will enable the UK to play an internationally leading role in addressing the challenges of understanding regional climate change and provide detailed information about impacts on the UK.
Future impacts risks and mitigation actions (TerraFIRMA), £9.5 million
Led by the National Centre for Atmospheric Science, in collaboration with:
British Antarctic Survey
British Geological Survey
Centre for Polar Observation and Modelling
National Centre for Earth Observation
National Oceanography Centre
Plymouth Marine Laboratory
UK Centre for Ecology & Hydrology.
Project partner is the Met Office Hadley Centre, UK.
This project will provide reliable guidance on the risks and impacts of future climate change. It will assess a range of mitigation strategies:
impacts on allowable carbon budgets and pathways to net zero
wider environmental, economic and societal impacts, for example, sustainable development goals
The following blog was written by PhD researcher, Amy Swiggs based at the University of Leeds.
Andy Shepherd, In’s Otosaka, Anne Braakmann-Folgmann and I travelled to Greenland in Spring 2022 for the European Space Agency’s (ESA’s) CRYO2ICE campaign. The campaign is an international effort to cross-validate ice-monitoring satellites, including CryoSat-2, ICESat-2, AltiKA, and Sentinel-3. The campaign was coordinated across the EGIG line on the Greenland Ice Sheet.
We flew to Iceland on March 28th and had two days in Reykjavik to finalise the experiment plan and calibrate equipment, such as the magna probe, used for measuring snow depth, and practice assembling the corner reflectors, used as a strong scattering surface for the Technical University of Denmark’s (DTU’s) airborne LIDAR. Anne flew to Greenland to prepare for analysing the ice cores the rest of us would collect on the ice sheet. We then had a five-hour drive through Iceland to Akureyri, where we had equipment stored, and would be boarding our Norlandair twin otter flight to Greenland the following day.
Bad weather in Ilulissat meant our plans changed, but fortunately Andy and In’s were able to collect an ice core on the EGIG line, before we all spent the night in Sisimiut, west Greenland. When the weather improved, we coordinated with the team at DTU to organise an overpass of their LIDAR over our corner reflectors on the EGIG line. We also collected snow depth measurements with the magna probe and weighed snow for snow density calculations. We did this at two sites on the EGIG line, with DTU spotting our corner reflectors at both sites.
The following day, we were on the ice again, collecting an ice core for analysis. The weather was sunny, but temperatures reached -30C on the ice during the campaign. We returned to Ilulissat and analysed the ice cores with Anne, which involved using fluorescent light to look for ice lenses and other distinguishable features in the cores. The following day we had a long flight back to Reykjavik, but fortunately had stunning views over the ice sheet throughout.
That marked the end of a very successful campaign. Steven George, University of Reading, provided invaluable support during the campaign, assisting with measurements and logistics. The airborne and coordination team at DTU included Rene Forsberg, Louise Sandberg S¸rensen, Henriette Skourup, Rene Fredensborg Hansen, and Sine Hvidegaard. Alessandro Di Bella (ESA) also assisted in the airborne campaign. We re grateful to the fantastic team effort in coordinating a highly successful campaign.
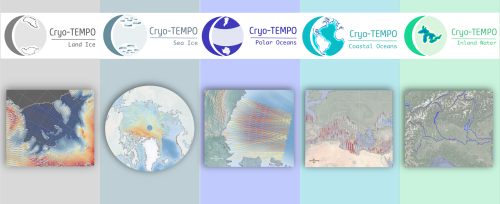
As of January 2022, ESA has started releasing new CryoSat-2 Thematic Products, dedicated to five distinct areas: Sea Ice, Land Ice, Polar Oceans, Coastal Oceans and Inland Waters.
Developed within the frame of the CryoSat-2 Thematic Products (Cryo-TEMPO) activity, these products benefit from agile and state-of-the-art altimetry processing workflows, which utilise dedicated processing for each domain and optimise data fidelity across each thematic surface.
The simplified format and inclusion of fully traceable uncertainties are designed to make CryoSat-2 datasets accessible to new communities of scientific and service users, who traditionally may have lacked the technical expertise required to utilise previous products. To ensure this, a group of thematic non-altimetry experts has been integral in testing and providing feedback on the prototype datasets during the product design stage.
The current product release represents the culmination of Phase 1 of the Cryo-TEMPO activities, which began in October 2020. The consortium is now working on algorithm evolutions for the next product release, which is scheduled for the beginning of 2023.
The new Cryo-TEMPO product files are distributed via ESA’s CryoSat-2 Science Server and cover the full duration of the CryoSat-2 mission, from 2010 to the present day.
Interested users can access the associated documentation on ESA’s Earth Online website. Further information can also be found on the project website.
Scientists monitoring the giant A68A Antarctic iceberg from space reveal that a huge amount of fresh water was released as it melted around the sub-Antarctic island of South Georgia.
Satellites revealed that 152 billion tonnes of fresh water entered the seas around the sub-Antarctic island of South Georgia when the megaberg A68A melted over 3 months in 2020/2021, according to a new study.
152 billion tonnes of water is equivalent to 20 times the amount of water in Loch Ness or 61 million Olympic sized swimming pools.
In July 2017, the A68A iceberg snapped off the Larsen-C Ice Shelf on the Antarctic Peninsula and began its 3.5 year, 4000 km journey across the Southern Ocean. At 5719 square kilometres quarter the size of Wales , it was the biggest iceberg on Earth when it formed and the sixth largest on record.
Around Christmas 2020, the berg received widespread attention as it drifted worryingly close to South Georgia, raising concerns it could harm the island’s fragile ecosystem.
Their findings show that the berg had melted enough as it drifted to avoid damaging the sea floor around South Georgia. However, a side effect of the melting was the release of a colossal 152 billion tonnes of fresh water in close proximity to the island a disturbance that could have a profound impact on the island’s marine habitat.
Anne Braakmann-Folgmann, a researcher at CPOM and PhD candidate at the University of Leeds School of Earth and Environment, is lead author of the study. She said: This is a huge amount of melt water, and the next thing we want to learn is whether it had a positive or negative impact on the ecosystem around South Georgia.
Because A68A took a common route across the Drake Passage, we hope to learn more about icebergs taking a similar trajectory, and how they influence the polar oceans.
For the first two years of its life, A68A stayed close to Antarctica in the cold waters of the Weddell Sea and experienced little in the way of melting. However, once it began its northwards journey across Drake Passage it travelled through increasingly warm waters and began to melt.
Altogether, the iceberg thinned by 67 metres from its initial 235 m thickness, with the rate of melting rising sharply as the berg drifted in the Scotia Sea around South Georgia.
Laura Gerrish, GIS and mapping specialist at BAS and co-author of the study said A68 was an absolutely fascinating iceberg to track all the way from its creation to its end. Frequent measurements allowed us to follow every move and break-up of the berg as it moved slowly northwards through iceberg alley and into the Scotia Sea where it then gained speed and approached the island of South Georgia very closely.
If an iceberg’s keel is too deep it can get stuck on the sea floor. This can be disruptive in several different ways; the scour marks can destroy fauna, and the berg itself can block ocean currents and predator foraging routes. However, this new study reveals that A68A collided only briefly with the sea floor and broke apart shortly afterwards, making it less of a risk in terms of blockage.
By the time it reached the shallow waters around South Georgia, the iceberg’s keel had reduced to 141 metres below the ocean surface, shallow enough to avoid the seabed which is around 150 metres deep.
Nevertheless, the ecosystem and wildlife around South Georgia will certainly have felt the impact of the colossal iceberg’s visit. When icebergs detach from ice shelves, they drift with the ocean currents and wind while releasing cold fresh meltwater and nutrients as they melt.
This process influences the local ocean circulation and fosters biological production around the iceberg. At its peak, the iceberg was melting at a rate of seven metres per month, and in total it released a staggering 152 billion tonnes of fresh water and nutrients.
The journey of A68A has been charted using observations from five different satellites. The iceberg’s area change was recorded using a combination of Sentinel-1, Sentinel-3, and MODIS imagery. Meanwhile, the iceberg’s thickness change was measured using CryoSat-2 and ICESat-2 altimetry. By combining these measurements, the iceberg’s area, thickness, and volume change were determined.
Tommaso Parrinello, CryoSat Mission Manager at the European Space Agency, said: Our ability to study every move of the iceberg in such detail is thanks to advances in satellite techniques and the use of a variety of measurements. Imaging satellites record the location and shape of the iceberg and data from altimetry missions add a third dimension as they measure the height of surfaces underneath the satellites and can therefore observe how an iceberg melts.
Further information:
Image credit: A68A iceberg approaching the island of South Georgia (14 December 2020). The left hand part of the image are clouds. Credit: MODIS image from NASA Worldview Snapshots.
Observing the Disintegration of the A68A Iceberg from Space is published in Remote Sensing of Environment. The article can be found at https://doi.org/10.1016/j.rse.2021.112855.
For additional information contact University of Leeds press officer Anna Harrison a.harrison@leeds.ac.uk
As global temperatures increase, the melting of the massive ice sheets that blanket Antarctica and Greenland has accelerated, making a significant contribution to sea-level rise. In total, Earth is losing around a trillion tonnes of ice each year which is not being replenished.
CPOM director, Andrew Shepherd of the University of Leeds is a leading climate scientist working with ESA and NASA. Join Andrew as he discusses how long-term satellite observations from ESA’s Climate Change Initiative are key in monitoring changes in ice sheets over decades.
Global warming has caused extreme ice melting events in Greenland to become more frequent and more intense over the past 40 years according to new research, raising sea levels and flood risk worldwide
Over the past decade alone, 3.5 trillion tonnes of ice has melted from the surface of the island and flowed downhill into the ocean.
That’s enough melted ice to cover the entire UK with around 15 metres of meltwater, or cover the entire city of New York with around 4,500 metres.
The new study, led by the University of Leeds, is the first to use satellite data to detect this phenomena known as ice sheet runoff from space.
The findings, published in Nature Communications, reveal that Greenland’s meltwater runoff has risen by 21% over the past four decades and has become 60% more erratic from one summer to the next.
Important step Lead author Dr Thomas Slater, a Research Fellow in Leeds Centre for Polar Observation and Modelling, said: As we’ve seen with other parts of the world, Greenland is also vulnerable to an increase in extreme weather events.
As our climate warms, it’s reasonable to expect that the instances of extreme melting in Greenland will happen more often observations such as these are an important step in helping us to improve climate models and better predict what will happen this century.
The study, funded by the European Space Agency (ESA) as part of its Polar+Surface Mass Balance Feasibility project, used measurements from the ESA’s CryoSat-2 satellite mission.
The research shows that over the past decade (2011 to 2020), increased meltwater runoff from Greenland raised the global sea level by one centimetre. One-third of this total was produced in just two hot summers (2012 and 2019), when extreme weather led to record-breaking levels of ice melting not seen in the past 40 years.
Raised sea levels caused by ice melt heightens the risk of flooding for coastal communities worldwide and disrupts marine ecosystems in the Arctic Ocean that indigenous communities rely on for food.
It can also alter patterns of ocean and atmospheric circulation which affect weather conditions around the planet.
Extreme weather During the past decade, runoff from Greenland has averaged 357 billion tonnes per year, reaching a maximum of 527 billion tonnes of ice melt in 2012, when changes in atmospheric patterns caused unusually warm air to sit over much of the ice sheet. This was more than twice the minimum runoff of 247 billion tonnes that occurred in 2017.
The changes are related to extreme weather events, such as heatwaves, which have become more frequent and are now a major cause of ice loss from Greenland because of the runoff they produce.
Dr Slater said: There are, however, reasons to be optimistic. We know that setting and meeting meaningful targets to cut emissions could reduce ice losses from Greenland by a factor of three, and there is still time to achieve this.
These first observations of Greenland runoff from space can also be used to verify how climate models simulate ice sheet melting which, in turn, will allow improved predictions of how much Greenland will raise the global sea level in future as extreme weather events become more common.
Greater understanding Study co-author Dr Amber Leeson, Senior Lecturer in Environmental Data Science at Lancaster University, said: Model estimates suggest that the Greenland ice sheet will contribute between about 3 and 23 cm to global sea-level rise by 2100.
This prediction has a wide range, in part because of uncertainties associated with simulating complex ice melt processes, including those associated with extreme weather. These new spaceborne estimates of runoff will help us to understand these complex ice melt processes better, improve our ability to model them, and thus enable us to refine our estimates of future sea level rise.
Finally, the study shows that satellites are able to provide instant estimates of summer ice melting, which supports efforts to expand Greenland’s hydropower capacity and Europe’s ambition to launch the CRISTAL mission to succeed CryoSat-2.
ESA’s CryoSat mission manager, Tommaso Parrinello, said: Since it was launched over 11 years ago, CryoSat has yielded a wealth of information about our rapidly changing polar regions. This remarkable satellite remains key to scientific research and the indisputable facts, such as these findings on meltwater runoff, that are so critical to decision-making on the health of our planet.
Looking further to the future, the Copernicus Sentinel Expansion mission CRISTAL will ensure that Earth’s vulnerable ice will be monitored in the coming decades. In the meantime, it is imperative that CryoSat remains in orbit for as long as possible to reduce the gap before these new Copernicus missions are operational.
A glacier in West Antarctica has been formally named after the city of Glasgow to mark its hosting of the COP26 climate change conference.
The Scottish city will welcome more than 100 world leaders to COP26, the 26th UN Climate Change Conference of Parties, from this weekend until Friday 12 November. The conference marks a key moment in human history for our response to climate change, especially given the impact of the COVID-19 pandemic.
The Glasgow Glacier is one of nine areas of fast flowing ice in the Getz basin to be named after locations of major climate treaties, conferences and reports, following a request by University of Leeds scientists.
CPOM PhD Researcher Heather Selley, from Leeds School of Earth and Environment, and an Enrichment Student at the Alan Turing Institute, identified 14 glaciers in the Getz basin of West Antarctica that are thinning and flowing more quickly into the ocean.
Her study, published in February 2021, revealed that 315 gigatonnes of ice has been lost from the Getz region over the last 25-years, adding 0.9 mm to global mean sea level – the equivalent of 126 million Olympic swimming pools of water.
To mark 42 years of collaboration on international science and climate policy decision-making, Heather requested that the nine unnamed glaciers in her study be named after the locations of major climate treaties, conferences and reports. Five of the glaciers were previously named for US explorers, researchers and officials working in the region.
The proposal was submitted by the Foreign, Commonwealth & Development Office on behalf of the UK Government and supported by the UK Antarctic Place-names Committee. The names will now be added to the international Composite Gazetteer for Antarctica, for use on maps, charts and future publications.
Heather said: “Our study was the first to show that glaciers in this remote region of Antarctica were speeding up. The glaciers are named in chronological order, with Geneva Glacier marking the first ever climate summit in 1979 on the west of the Getz study region and Glasgow Glacier marking the upcoming COP26 on the east.”
“Naming the glaciers after these locations is a great way to celebrate this international collaboration on climate change science and policy over the last 42 years. We wanted to permanently mark the outstanding effort the scientific community has put into measuring the present-day impact of climate change, and its predicted future evolution.”
Amanda Milling, Foreign Commonwealth and Development Officer for Polar Regions, said: “Naming these fast-flowing glaciers sends a clear message that time is running out for action on climate change. It also recognises the importance of global collaboration as we look towards Glasgow and COP26.”
“Scientists estimate that over the past 25 years the Getz region has added the equivalent of 126 million Olympic swimming pools of water to world oceans, due to climate change. The time is now for urgent action.”
Dramatic changes in ice cover and images of the Antarctica have become synonymous with the climate crisis. Over the last 40 years, satellites have observed huge iceberg calving events, change in the flow of glaciers and regions of rapidly thinning ice, all of which improves our understanding of how the ice sheet contribution to sea level rise has changed and provides essential evidence of the impact of climate change.
The 500km-long Getz ice shelf was discovered during the 1940s by the United States Antarctic Service (USAS) and the US Navy. It was first mapped by the United States Geological Survey from US Navy air pictures taken between 1962 – 65, and named by the USAS after George F Getz of Chicago, who helped furnish the seaplane for the expedition.
Modern exploration of the area is done using satellite imaging, with space playing an increasing role in helping scientists to monitor, understand and tackle climate change. The European Space Agency earth observation data provides high-resolution satellite images taken every six days by Sentinel-1, part of the Copernicus Programme satellite constellation. This allows researchers to measure localised speed changes with ever greater detail.
Dr Anna Hogg, Associate Professor in Leeds’ School of Earth and Environment, said: “The climate crisis affects all of us, whether through flooding of our homes, increased storm frequency, reduced crop harvests, or the loss of habitats and biodiversity in the natural environment, with some communities impacted much more than others. Whilst these new glacier names celebrate the knowledge gained through scientific collaboration and the action taken through policy, it is clear now that much more must be done.”
“I am inspired by the school climate strikes, which remind all of us that we are only temporary gatekeepers, and have a responsibility to protect planet Earth for the next generation. There is no doubt that there’s a need for urgent action, we have great hope in the power of international collaboration which can enable significant progress to be made at COP26 this year.
“The recent IPCC AR6 report finds that unless there are immediate, rapid and large-scale reductions in greenhouse gas emissions, it will not be possible to limit warming close to 1.5°C or even 2°C.”
The Geneva Glacier flows at the western end of the Getz Ice Shelf and was named after the world’s first climate conference in 1979.
The Rio Glacier lies further east and commemorates the first Earth Summit in 1992 where the United Nations Framework Convention on Climate Change (UNFCCC) was opened for signatures along with its sisters the Rio convention, the UN convention on biological diversity and the UN convention to combat desertification.
The Berlin Glacier flows further east and is named after the first Conference of Parties (COP) in 1995 which assessed the progress of dealing with climate change. It marked the uniting of the world to tackle climate change and the agreement on a mandate for future negotiations.
Still further east lies the Kyoto Glacier commemorating the formal adoption of the Kyoto Protocol at COP3 in 1997, which legally bound developed countries to emission reduction targets.
The Bali Glacier marks the release of the Intergovernmental Panel on Climate Change forth assessment report (AR4) in 2007. Around this time climate science entered into the popular consciousness. At the thirteenth Conference of Parties (COP13) parties agreed on the Bali road map, which charted the way towards post-2012 outcome with a working group on long-term cooperative action under the convention.
The Stockholm Glacier honours the Intergovernmental Panel on Climate Change fifth assessment report (AR5) approval session in 2014. This report represents the biggest ever coming together of scientists at the time.
The Paris Glacier memorialises the agreement of a legally binding treaty in 2015 which aimed to limit global warming to well below 2°C, preferably below 1.5°C, compared to pre-industrial levels. It was adopted by 196 parties that together represented at least 55 % of the global greenhouse gas emissions.
The Incheon Glacier marks the meeting of the IPCC to consider the special report of global warming of 1.5°C in 2015. This marked the first time the three different IPCC working groups worked together to produce a report in an interdisciplinary manner.
Finally, the Glasgow Glacier flows at the very east end of the Getz basin and is named after Glasgow which will host the 26th UN Climate Change Conference of Parties (COP26) later this year. It marks a key moment in human history for our response to climate change especially given the impact of the COVID-19 pandemic.
Further information
“Widespread increase in dynamic imbalance in the Getz region of Antarctica from 1994 to 2018” was published in Nature Communications on 23 February 2021. DOI: 10.1038/s41467-021-21321-1
For further information and interviews, contact the University of Leeds press office via pressoffice@leeds.ac.uk.
Sea ice in the coastal regions of the Arctic may be thinning up to twice as fast as previously thought, according to a new modelling study led by CPOM UCL researchers.
Sea ice thickness is inferred by measuring the height of the ice above the water, and this measurement is distorted by snow weighing the ice floe down. Scientists adjust for this using a map of snow depth in the Arctic that is decades out of date and does not account for climate change.
In the new study, published in the journal The Cryosphere, researchers swapped this map for the results of a new computer model designed to estimate snow depth as it varies year to year, and concluded that sea ice in key coastal regions was thinning at a rate that was 70% to 100% faster than previously thought.
Robbie Mallett (CPOM PhD researcher, UCL), the PhD student who led the study, said: “The thickness of sea ice is a sensitive indicator of the health of the Arctic. It is important as thicker ice acts as an insulating blanket, stopping the ocean from warming up the atmosphere in winter, and protecting the ocean from the sunshine in summer. Thinner ice is also less likely to survive during the Arctic summer melt.”
“Previous calculations of sea ice thickness are based on a snow map last updated 20 years ago. Because sea ice has begun forming later and later in the year, the snow on top has less time to accumulate. Our calculations account for this declining snow depth for the first time, and suggest the sea ice is thinning faster than we thought.”
Co-author Professor Julienne Stroeve (CPOM Associate Investigator, UCL) said: “There are a number of uncertainties in measuring sea ice thickness but we believe our new calculations are a major step forward in terms of more accurately interpreting the data we have from satellites.”
“We hope this work can be used to better assess the performance of climate models that forecast the effects of long-term climate change in the Arctic – a region that is warming at three times the global rate, and whose millions of square kilometres of ice are essential for keeping the planet cool.”
To calculate sea ice thickness researchers used radar from the European Space Agency’s CryoSat-2 satellite. By timing how long it takes for radar waves to bounce back from the ice, they can calculate the height of the ice above the water, from which they can infer the ice’s total thickness.
In the new study, researchers used a novel snow model previously developed by researchers at UCL and Colorado State University, SnowModel-LG, which calculates snow depth and density using inputs such as air temperature, snowfall and ice motion data to track how much snow accumulates on sea ice as it moves around the Arctic Ocean. By combining the results of the snow model with satellite radar observations, they then estimated the overall rate of decline of sea ice thickness in the Arctic, as well as the variability of sea ice thickness from year to year.
They found that the rate of decline in the three coastal seas of Laptev, Kara and Chukchi seas increased by 70%, 98% and 110% respectively, when compared to earlier calculations. They also found that, across all seven coastal seas, the variability in sea ice thickness from year to year increased by 58%.
Sea ice in the coastal seas typically varies from half a metre to two metres thick. Increasingly, the ice in this region is not surviving the summer melt. The faster thinning of sea ice in the coastal Arctic seas has implications for human activity in the region, both in terms of shipping along the Northern Sea Route for a larger part of the year, as well as the extraction of resources from the sea floor such as oil, gas and minerals.
Mallett said: “More ships following the route around Siberia would reduce the fuel and carbon emissions necessary to move goods around the world, particularly between China and Europe. However, it also raises the risk of fuel spillages in the Arctic, the consequences of which could be dire. The thinning of coastal sea ice is also worrying for indigenous communities, as it leaves settlements on the coast increasingly exposed to strong weather and wave action from the emerging ocean.”
Mallett, Professor Stroeve and co-author Dr Michel Tsamados (CPOM Associate Investigator, UCL) spent several weeks investigating snow and ice in the Arctic onboard the German research vessel Polarstern, which explored the central Arctic Ocean in 2019 and 2020.
The study was funded by the UK’s Natural Environment Research Council, the European Space Agency (ESA), and the US National Aeronautics and Space Administration (NASA).
Dr Rosemary Willatt, a CPOM Research Fellow delivers Secondary School Science Advisors programme.
Rosemary Willatt, a Research Fellow in UCL Earth Science’s Centre for Polar Observation and Modelling, has developed a new outreach idea based around a flipped learning approach and a reversed power dynamic between students and teachers. Working with the Geobus Leader, Amy Edgington, she presented information on her own work on remote sensing of sea ice, and gave secondary school students the chance to take an active role in the research through posing science questions for Rosie to research.
Martin Hains, a teacher at Leyton College, said:
“Collaborating with UCL has helped to develop our learner’s critical thinking skills. Students have gained first-hand experience of cutting-edge climate research and have been inspired to learn more about the polar regions and their impact on climate change.”
The students have come up with a series of fantastic questions for Rosie, many of which are active topics of research for her or other scientists, giving her the opportunity to develop her own thinking and to bring up-to-date climate science to the students. She hopes to work with other schools or colleges in future.
Noel Gourmelen, CPOM Associate Investigator at University of Edinburgh, is amongst the authors of a recent study, which shows that mountain glaciers in the Gulf Alaska and in High Mountain Asia have lost 5% of their volume of ice over last decade. The full story can be found at ESA.
As our climate warms, ice melting from glaciers around the world is one of main causes of sea-level rise. As well as being a major contributor to this worrying trend, the loss of glacier ice also poses a direct threat to hundreds of millions of people relying on glacier runoff for drinking water and irrigation. With monitoring mountain glaciers clearly important for these reasons and more, new research, based on information from ESA’s CryoSat mission, shows how much ice has been lost from mountain glaciers in the Gulf Alaska and in High Mountain Asia since 2010.
Monitoring glaciers globally is a challenge because of their sheer number, size, remoteness and rugged terrain they occupy. Various satellite instruments offer key data to monitor change, but one type of spaceborne sensor – the radar altimeter – has seen limited use over mountain glaciers.
Traditionally, satellite radar altimeters are used to monitor changes in the height of the sea surface and changes in the height of the huge ice sheets that cover Antarctica and Greenland. They work by measuring the time it takes for a radar pulse transmitted from the satellite to reflect from Earth’s surface and return to the satellite. Knowing the exact position of the satellite in space, this measure of time is used to calculate the height of the surface below.
However, the footprint of this type of instrument is generally too coarse to monitor mountain glaciers. ESA’s CryoSat pushes the boundaries of radar altimetry and a particular way of processing its data “swath processing“ make it possible to map glaciers in fine detail.
A paper published recently in The Cryosphere describes how scientists used CryoSat to investigate ice loss in the Gulf of Alaska and High Mountain Asia.
They found that between 2010 and 2019, the Gulf of Alaska lost 76 Gt of ice per year while High Mountain Asia lost 28 Gt of ice per year. These losses are equivalent to adding 0.21 mm and 0.05 mm to sea level rise per year, respectively.
Livia Jakob, from Earthwave, explains, “One of the unique properties of this dataset is that we can look at ice trends at exceptionally high resolution in space and time. This enabled us to discover changes in trends, such as the increased ice loss from 2013 onwards in parts of the Gulf of Alaska, which is linked to climatic changes.”
The study, which was carried out through ESA’s Science for Society programme, also shows that almost all regions have lost ice, with the exception of the Karakoram-Kunlun area in High Mountain Asia, a phenomenon known was the “Karakoram anomaly”.
Noel Gourmelen, CPOM Associate Investigator at University of Edinburgh, is amongst the authors of a recent study, which shows that mountain glaciers in the Gulf Alaska and in High Mountain Asia have lost 5% of their volume of ice over last decade. The full story can be found at ESA.
As our climate warms, ice melting from glaciers around the world is one of main causes of sea-level rise. As well as being a major contributor to this worrying trend, the loss of glacier ice also poses a direct threat to hundreds of millions of people relying on glacier runoff for drinking water and irrigation. With monitoring mountain glaciers clearly important for these reasons and more, new research, based on information from ESA’s CryoSat mission, shows how much ice has been lost from mountain glaciers in the Gulf Alaska and in High Mountain Asia since 2010.
Monitoring glaciers globally is a challenge because of their sheer number, size, remoteness and rugged terrain they occupy. Various satellite instruments offer key data to monitor change, but one type of spaceborne sensor “the radar altimeter“ has seen limited use over mountain glaciers.
Traditionally, satellite radar altimeters are used to monitor changes in the height of the sea surface and changes in the height of the huge ice sheets that cover Antarctica and Greenland. They work by measuring the time it takes for a radar pulse transmitted from the satellite to reflect from Earth’s surface and return to the satellite. Knowing the exact position of the satellite in space, this measure of time is used to calculate the height of the surface below.
However, the footprint of this type of instrument is generally too coarse to monitor mountain glaciers. ESA’s CryoSat pushes the boundaries of radar altimetry and a particular way of processing its data “swath processing“ make it possible to map glaciers in fine detail.
A paper published recently in The Cryosphere describes how scientists used CryoSat to investigate ice loss in the Gulf of Alaska and High Mountain Asia.
They found that between 2010 and 2019, the Gulf of Alaska lost 76 Gt of ice per year while High Mountain Asia lost 28 Gt of ice per year. These losses are equivalent to adding 0.21 mm and 0.05 mm to sea level rise per year, respectively.
Livia Jakob, from Earthwave, explains, “One of the unique properties of this dataset is that we can look at ice trends at exceptionally high resolution in space and time. This enabled us to discover changes in trends, such as the increased ice loss from 2013 onwards in parts of the Gulf of Alaska, which is linked to climatic changes.”
The study, which was carried out through ESA’s Science for Society programme, also shows that almost all regions have lost ice, with the exception of the Karakoram-Kunlun area in High Mountain Asia, a phenomenon known was the “Karakoram anomaly”.
Noel Gourmelen, from the University of Edinburgh, said, “It is astonishing to think that over last decade alone, both regions have lost 5% of their volume of ice. What CryoSat has accomplished also is astonishing. While glaciers were a secondary objective of the mission, few would have thought possible to use radar altimetry in regions with extremely complex topography like High Mountain Asia and the Gulf of Alaska.
“But thanks to a brilliant altimeter design, dedicated support from ESA, and many years of research by the community, interferometric radar altimeters are now part of the toolset to monitor glacier change globally.”
This research, as well as that published in a related paper covering the entire Arctic region apart from Greenland, demonstrates that this unique high-resolution radar altimetry dataset can provide crucial information to better quantify and understand glacier changes on a global scale. This also opens up possibilities to monitor glaciers globally with satellites such as the planned CRISTAL mission, part of the expansion of Europe’s Copernicus programme.