AI can map giant icebergs from satellite images 10,000 times faster than humans

AI can map giant icebergs from satellite images 10,000 times faster than humans

Scientists have trained an artificial intelligence (AI) system to accurately map the surface area and outline of giant icebergs captured on satellite images in just one-hundredth of a second.

It is a major advance on existing automated systems which struggle to distinguish icebergs from other features in satellite images. Their findings are published today in leading journal The Cryosphere. Icebergs have a significant impact on the polar environment and monitoring them is critical for both maritime safety and scientific study. They can be extremely large in some cases the size of small countries and can pose a risk to passing ships. As they melt, icebergs release nutrients and freshwater into the seas, and this can have an impact on marine ecosystems.

The study was led by Dr Anne Braakmann-Folgmann at the Centre for Polar Observation and Modelling, which recently moved to Northumbria University from the University of Leeds. Using an algorithm called U-net a type of neural network Dr Braakmann-Folgmann and her colleagues trained a computer to accurately map the outline of icebergs from images taken by Sentinel-1 satellites operated by the European Space Agency. Although manual or human interpretation of satellite images is more accurate, it can take several minutes to accurately outline a single iceberg. If that has to be repeated numerous times, the process quickly becomes time-consuming and laborious.

The algorithm uses an approach designed for manipulating images. By analysing the pixels in the image, it can determine the boundary or outline of objects, in this case it is identifying the outline of the iceberg.

The team also compared the effectiveness of the U-net algorithm to two other state-of-the-art algorithms currently used to map icebergs, known as k-means and Otsu, and programmed them to identify the biggest iceberg in a series of satellite images. They tested all three algorithms on satellite images of seven huge icebergs, which were all between 54km2 and 1052km2. This equates to the icebergs being the same size as the city of Bern in Switzerland and Hong Kong. Up to 46 images of each iceberg were used that were taken over a six-year period. Over a series of tests, the U-net algorithm clearly outperformed both k-means and Otsu and was more effective in delineating the outline of an iceberg.
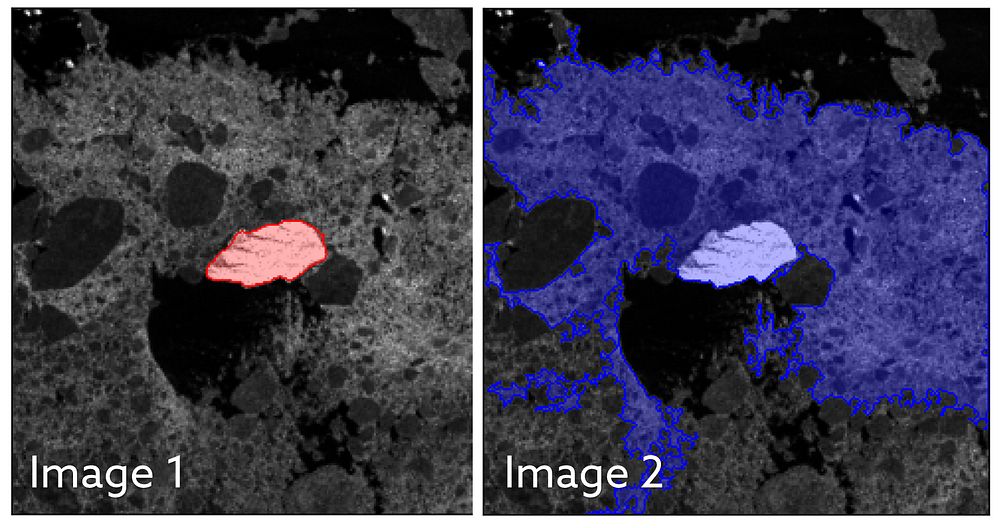
Image 1 shows the U-net algorithm correctly identifying the iceberg, which is surrounded by sea ice. The iceberg is highlighted in red. However, in image 2, the k-means algorithm has identified the iceberg and the sea ice as a single iceberg. It is unable to differentiate between the two, despite them being distinct objects, where sea ice is rather flat ice on the sea and an iceberg standing metres above it. U-net showed an average of a 5% lower estimate of the area of an iceberg, whereas the k-means and Otsu algorithms returned average figures for iceberg area that were between 150% to 170% too large. It is believed that these algorithms were including sea ice and even nearby coastline in their calculations.
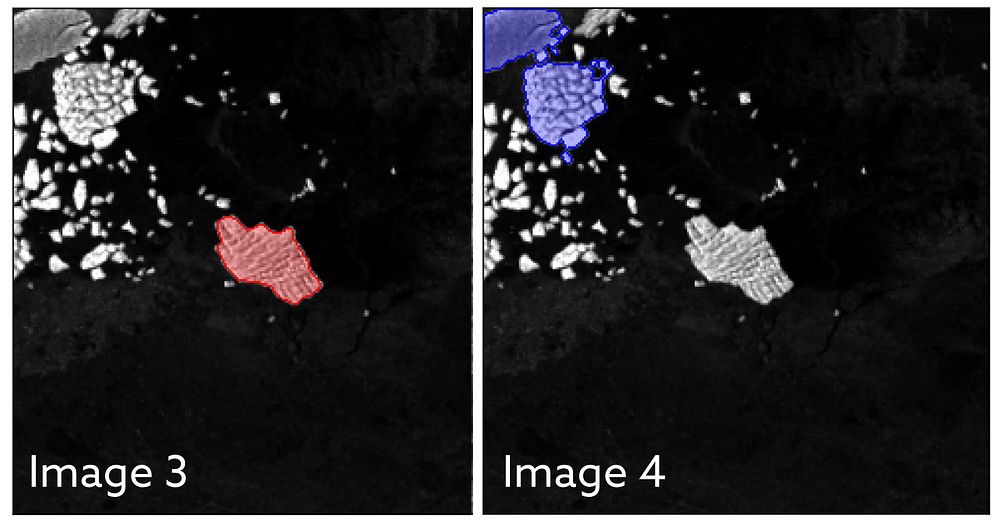
Image 3 shows shows the U-net algorithm correctly identifying the iceberg, which is highlighted in red. However, in image 4 you can see that the k-means algorithm has incorrectly identified a cluster of smaller icebergs and ice fragments, shown in blue, as one large iceberg. Professor Andrew Shepherd, Director of the Centre for Polar Observation and Modelling and Head of the Department of Geography and Environmental Sciences at Northumbria University was one of the co-authors of the study. He said: “This study shows that machine learning will enable scientists to monitor remote and inaccessible parts of the world in almost real-time. And with machine learning, the algorithm will become more accurate as it learns from errors in the way it interprets a satellite image. Dr Braakmann-Folgmann said the technology could result in new services which provide information about the shape and size of giant icebergs. Current mapping services show only the midpoint or central location and length of icebergs. Interpretation by this new approach means their outline and area can be calculated. Icebergs exist in hard-to-reach parts of the world and satellites are not only a fantastic tool to observe where they are, they can help scientists understand the process of how they melt and eventually begin to break apart. Being able to automatically map iceberg extent with enhanced speed and accuracy paves the way for an operational service providing iceberg outlines on a regular, automated basis. Combining them with measurements of iceberg thickness, also enables scientists to monitor where giant icebergs are releasing vast quantities of freshwater into the oceans. The paper Mapping the extent of giant Antarctic icebergs with Deep Learning is published in The Cryosphere. Northumbria University is home to one of the world’s leading groups in the studies of the interactions between ice sheets and oceans. The team of researchers are working to explore the future of ice sheets and glaciers worldwide in a warming world. This involves understanding the causes of ongoing changes in Antarctica, Greenland and alpine areas, as well as assessing future changes and resulting impacts on human environments globally. The University was recently awarded £9 million to become a Centre for Doctoral Training in Artificial Intelligence. The funding from UK Research and Innovation will see Northumbria specialising in citizen-centred artificial intelligence, focusing on the inclusion of citizens in the design and evaluation of AI, helping to ensure this rapidly advancing technology works for everyone.

Northumbria University Press Release: AI can map giant icebergs from satellite images 10,000 times faster than humans | Northumbria University, Newcastle (mynewsdesk.com)

ESA:ESA – AI maps icebergs 10,000 times faster than humans

Polar ice sheet melting records have toppled during the past decade

Press release: 20 April 2023, Northumbria University – Polar ice sheet melting records have toppled during the past decade | Northumbria University, Newcastle

The seven worst years for polar ice sheets melting and losing ice have occurred during the past decade, according to new research, with 2019 being the worst year on record.

The melting ice sheets now account for a quarter of all sea level rise a fivefold increase since the 1990’s according to IMBIE, an international team of researchers who have combined 50 satellite surveys of Antarctica and Greenland taken between 1992 and 2020.

Their findings are published today in the journal Earth System Science Data.

Global heating is melting the polar ice sheets, driving up sea levels and coastal flooding around our planet. Ice losses from Greenland and Antarctica can now be reliably measured from space by tracking changes in their volume, gravitational pull, or ice flow.  NASA and the European Space Agency (ESA) and awarded funding to the Ice Sheet Mass Balance Intercomparison Exercise (IMBIE) in 2011 to compile the satellite record of polar ice sheet melting. Data collected by the team is widely used by leading organisations, including by the Intergovernmental Panel on Climate Change (IPCC).

In their latest assessment, the IMBIE Team which is led by Northumbria University’s Centre for Polar Observations and Modelling have combined 50 satellite surveys of Antarctica and Greenland to determine their rate of ice melting. They have found that Earth’s polar ice sheets lost 7,560 billion tonnes of ice between 1992 and 2020 equivalent to an ice cube that would be 20 kilometres in height.

The polar ice sheets have together lost ice in every year of the satellite record, and the seven highest melting years have occurred in the past decade.

The satellite records show that 2019 was the record melting year when the ice sheets lost a staggering 612 billion tonnes of ice.

This loss was driven by an Arctic summer heatwave, which led to record melting from Greenland peaking at 444 billion tonnes that year. Antarctica lost 168 billion tonnes of ice the sixth highest on record due to the continued speedup of glaciers in West Antarctica and record melting from the Antarctic Peninsula. The East Antarctic Ice Sheet remained close to a state of balance, as it has throughout the satellite era.

Melting of the polar ice sheets has caused a 21 mm rise in global sea level since 1992, almost two thirds (13.5 mm) of which has originated from Greenland and one third (7.4 mm) from Antarctica.

In the early 1990s, ice sheet melting accounted for only a small fraction (5.6 %) of sea level rise. However, there has been a fivefold increase in melting since then, and they are now responsible for more than a quarter (25.6 %) of all sea level rise. If the ice sheets continue to lose mass at this pace, the IPCC predicts that they will contribute between 148 and 272 mm to global mean-sea level by the end of the century.

Professor Andrew Shepherd, Head of the Department of Geography and Environmental Sciences at Northumbria University and founder of IMBIE, said:

After a decade of work we are finally at the stage where we can continuously update our assessments of ice sheet mass balance as there are enough satellites in space monitoring them, which means that people can make use of our findings immediately.

Dr Ines Otosaka from the University of Leeds, who led the study, said:

Ice losses from Greenland and Antarctica have rapidly increased over the satellite record and are now a major contributor to sea level rise. Continuously monitoring the ice sheets is critical to predict their future behaviour in a warming world and adapt for the associated risks that coastal communities around the world will face.

This is now the third assessment of ice loss produced by the IMBIE team, due to continued cooperation between the space agencies and the scientific community. The first and second assessments were published in 2012 and 2018/19.

Over the past few years, ESA and NASA have made a dedicated effort to launch new satellite missions capable of monitoring the polar regions. The IMBIE project has taken advantage of these to produce more regular updates, and, for the first time, it is now possible to chart polar ice sheet losses every year.

This third assessment from the IMBIE Team, funded by the ESA and NASA, involved a team of 68 polar scientists from 41 international organisations using measurements from 17 satellite missions, including for the first time from the GRACE-FO gravity mission. Importantly, it brings the records of ice loss from Antarctica and Greenland in line, using the same methods and covering the same period in time. The assessment will now be updated annually to make sure that the scientific community has the very latest estimates of polar ice losses.

Dr Diego Fernandez, Head of Research and Development at ESA, said:

This is another milestone in the IMBIE initiative and represent an example of how scientists can coordinate efforts to assess the evolution of ice sheets from space offering unique and timely information on the magnitude and onset of changes.

The new annual assessments represent a step forward in the way IMBIE will help to monitor these critical regions, where variations have reached a scale where abrupt changes can no longer be excluded.

The study, Mass balance of the Greenland and Antarctic ice sheets from 1992 to 2020, is published in the journal Earth System Science Data, and the new dataset is publicly available on the British Antarctic Survey website.

Guest EGU Blog – For Dummies: Radar altimetry for measuring ice sheet elevation changes

CPOM scientist, Inès Otosaka features as the guest EGU blogger and talks about the importance of radar altimetry in glaciology for predicting future sea-level rise – a fabulous intro to radar altimetry & satellites.

The full blog can be found here: Cryospheric Sciences | For Dummies: Radar altimetry for measuring ice sheet elevation changes (egu.eu)

Greenland and Antarctica surface elevation changes from CryoSat-2. Credit: ESA, Inès Otosaka.

ESA CryoVEx/DEFIANT Antarctica campaign

The following blog was written by Research Fellow, Inès Otosaka based at the University of Leeds.

Last month (December 2022), I went to Antarctica for the first time to conduct some ground experiments over Adelaide Island, located on the western side of the Antarctic Peninsula, as part of the joint ESA CryoVEx/DEFIANT Antarctica campaign.

This campaign aimed to collect a wide range of datasets to investigate drivers of recent Antarctic sea ice changes in the Weddell Sea but also to help interpret differences between land ice height and sea ice thickness retrievals from ESA’s CryoSat-2 radar altimeter and NASA’s ICESat-2 laser altimeter. As part of the CRYO2ICE campaign, CryoSat-2 orbit was recently raised so that CryoSat-2 and ICESat-2 ground tracks coincide in space and time periodically over Antarctica. This campaign was thus a unique opportunity to collect ground and airborne measurements to complement these coincident satellite datasets and better understand the differences between radar and laser data.

This involved sending scientists from the University of Leeds (Andrew Shepherd and myself), from ESA (Isobel Lawrence also a former CPOM colleague), from BAS (Galle Veyssire and Carl Robinson), and from DTU (Sebastian Simonsen) to Antarctica for two weeks to collect these datasets. However, many more colleagues were involved in the preparations ahead of the campaign from the testing of the various instruments to the coordination of the campaign logistics and contributed greatly to the success of this campaign.

CryoVEx/DEFIANT team in the hangar at Rothera (from left to right: Carl Robinson, Sebastian Simonsen, Andrew Shepherd, In’s Otosaka, Isobel Lawrence, and Galle Veyssire)

Andy and I departed from Leeds on 29th November and after travelling more than 13,000 km, we arrived in Punta Arenas at the tip of Chile where we met with the rest of the scientific team. We stayed for four days in Punta Arenas waiting for the weather to clear up for our flight to Antarctica and on 5th December, we finally boarded our plane to Rothera, the British Research Station where we would be based for the next two weeks.

We were greeted with spectacular views of the station on our arrival with lots of icebergs and after a tour of the station, we reviewed our plans for the next few days. While Andy and I were in charge of collecting the ground measurements, Isobel, Galle, Carl, and Sebastian were in charge of collecting the airborne measurements. We spent the first day preparing our kit before going to the field while the airborne team started setting up the DASH-7 for the airborne surveys. The DASH-7 is usually used as a passenger aircraft to transport people between Rothera and Punta Arenas (it had been 25 years since it was last used as a scientific survey plane), which meant that all the seats had to be removed so that racks of instruments could be installed inside the plane instead. The airborne team then flew to the Weddell Sea, trying to follow the CRYO2ICE satellite tracks as closely as possible in time and space, which involved some long hours flying on the DASH-7 monitoring the various instruments to make sure that all the data were being acquired properly.

In the meantime, on the ground, we installed four corner reflectors to be surveyed by the airborne team, which will be used for calibrating the different datasets together after the campaign. These very large metal reflectors are digged 1-meter deep into the snow and set up to be around 2 meters above the ground so they can provide a common reference surface for the radar and laser data.

Installing a corner reflector on Fuchs Ice piedmont, Adelaide Island

We also collected some shallow firn cores around the island to measure the density and stratigraphy of the firn. We are especially interested in the depth of ice lenses that form within the firn as those are the signatures of past melt events and we have seen in Greenland that they change the scattering properties of the firn, which can impact surface heights measurements from CryoSat-2.

Drilling 7-meter deep to collect a firn core on Fuchs Ice piedmont, Adelaide Island

We had great weather conditions during those two weeks, and managed to collect all the measurements we had hoped for thanks to the support of the incredible team working at Rothera research station, including the field guides and pilots that came with us in the field, staff at the hangar, and Maz the science coordinator among many others!

Finally, while we were busy for most days we still managed to find some time to walk around the station and were lucky enough to spot some penguins, seals, and even a pod of orcas! This campaign was a great success and it was incredibly rewarding to see all the work that had been done over the months preceding the actual fieldwork come to fruition. Next, we will be analysing all the data collected, which is another exciting step although it will have to be done from our office desks far from the beautiful scenery of Antarctica!

Penguins around Rothera Point

Protecting Our Planet Day 22

CPOM Director, Professor Andy Shepherd (University of Leeds) features in a STEM Learning episode on Protecting Our Ice, its now available to watch online and includes a live link up with BAS scientists from the bottom of the Earth at Rothera Research Station in Antarctica discussing their research, a live introduction from the Captain onboard the RRS Sir David Attenborough and exclusive interviews and live Q&A with the Executive Producer and Series Producer of Frozen Planet II.

CPOM at COP27

PhD researcher, Robbie Mallett (UCL) attended COP27 in Sharm El Sheikh, Egypt, with the International Cryosphere Climate Initiative. During the conference he gave talks and appeared on panels in the Cryosphere Pavilion. As well as running the pavilion, the ICCI released the 2022 State of The Cryosphere Report, which Robbie helped to launch to the media and COP participants.

Robbie and the ICCI also campaigned for greater recognition of the cryosphere in COP negotiations. This year the cryosphere was specifically mentioned in the conference’s cover declaration for the first time, and the ICCI coordinated a new multinational coalition, named the Ambition on Melting Ice https://iccinet.org/ambition-on-melting-ice/

Tamsin Edwards: New Parliamentary “Thematic Research Lead”

Congratulations to CPOM associate, Tamsin Edwards (KCL) who in 2023, will be on secondment as a new Parliamentary “Thematic Research Lead”: helping to provide evidence to Parliament on climate & environmental science.

Tamsin will each join new thematic policy hubs which will bring together staff from POST, the House of Commons Library and Select Committee teams, ensuring greater co-ordination and a better flow of research information through Parliament.

Read the full story here: POST launches new research collaboration with academics based in Parliament – POST

Photo credit: Marlon Maya on Unsplash

Satellites now get full-year view of Arctic sea-ice

Satellites can now measure the thickness of Arctic sea ice in the summer months for the first time, thanks to a new study involving UCL researchers and CPOM associates, Professor Julienne Stroeve and Dr Michel Tsamados.

Until now, satellites could only measure sea ice thickness between October and March, when the ice and snow are cold and dry. In the warmer months, melt ponds on top of the ice floes confused the instruments, which could not be used to distinguish between melted ice on an ice floe and the ocean.

In the new study, published in the journal Nature, researchers used an artificial intelligence technique to correct this problem, in which an algorithm was trained on thousands of simulations of satellite data to reliably distinguish between melt ponds and the ocean.

Click here to view the UCL full article.

All Eyes on Earth

Earth’s ice is melting 65% faster than the 1990s. But without satellites, we would be blind to the true status of global climate change.

CPOM Scientist, Dr Tom Slater’s (University of Leeds) recent article ‘All Eyes on Earth’ written for a Royal Museums Greenwich exhibition can be found here:

Why satellites are critical to fighting climate change | Royal Museums Greenwich (rmg.co.uk)

“Satellite observations have shown that the ice sheets are responding to climate change within just my lifetime.” 

International Astronautical Congress in Paris

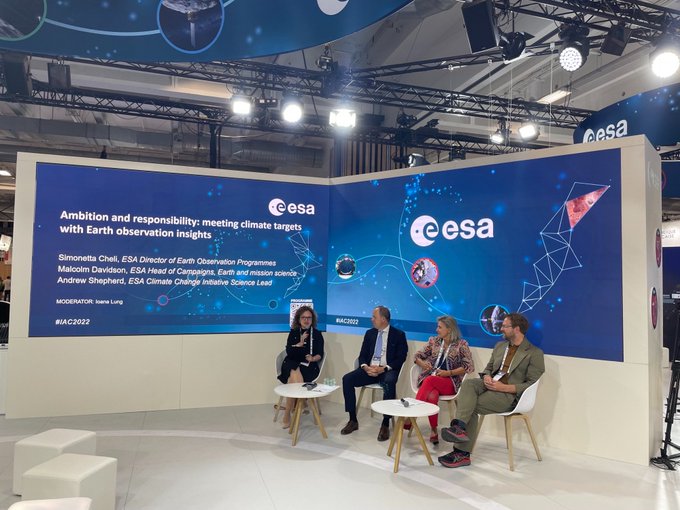
CPOM Director, Professor Andy Shepherd (University of Leeds) joined Simonetta Cheli, ESA’s Programmes and Head of ESRIN (ESA establishment in Italy) and co at the IAC2022 to discuss how ESA is preparing to address climate change.  You can also watch Andy Shepherd answering how we raise awareness on climate change and what can scientists do?

“We need to tell people good news stories about climate recovery. There’s hope!”

Watch here: Prof. Andy Shepherd on communicating climate awareness to the public